Fuel Monitoring System for Construction Equipment
A practical guide for EPC and P&M teams to move from alert noise to verified, enforceable diesel control.
You already know diesel is disappearing from site operations. The issue is not whether there is loss. The issue is whether you can prove where it happened, when it happened, and who should own it.
Most EPC and infrastructure teams face the same monthly loop: logsheets show normal consumption, operator notes sound plausible, and alerts are too weak to survive confrontation. Without verified evidence, meetings close with "monitor closely" and the same losses repeat next month.
A fuel monitoring system for construction equipment is meant to break this cycle. But only when it is deployed as an operations process, not just a dashboard. This guide explains what the system is, how theft patterns appear in data, how to verify mismatch events, and what outcomes a P&M team should demand.
What Is a Fuel Monitoring System for Construction Equipment?
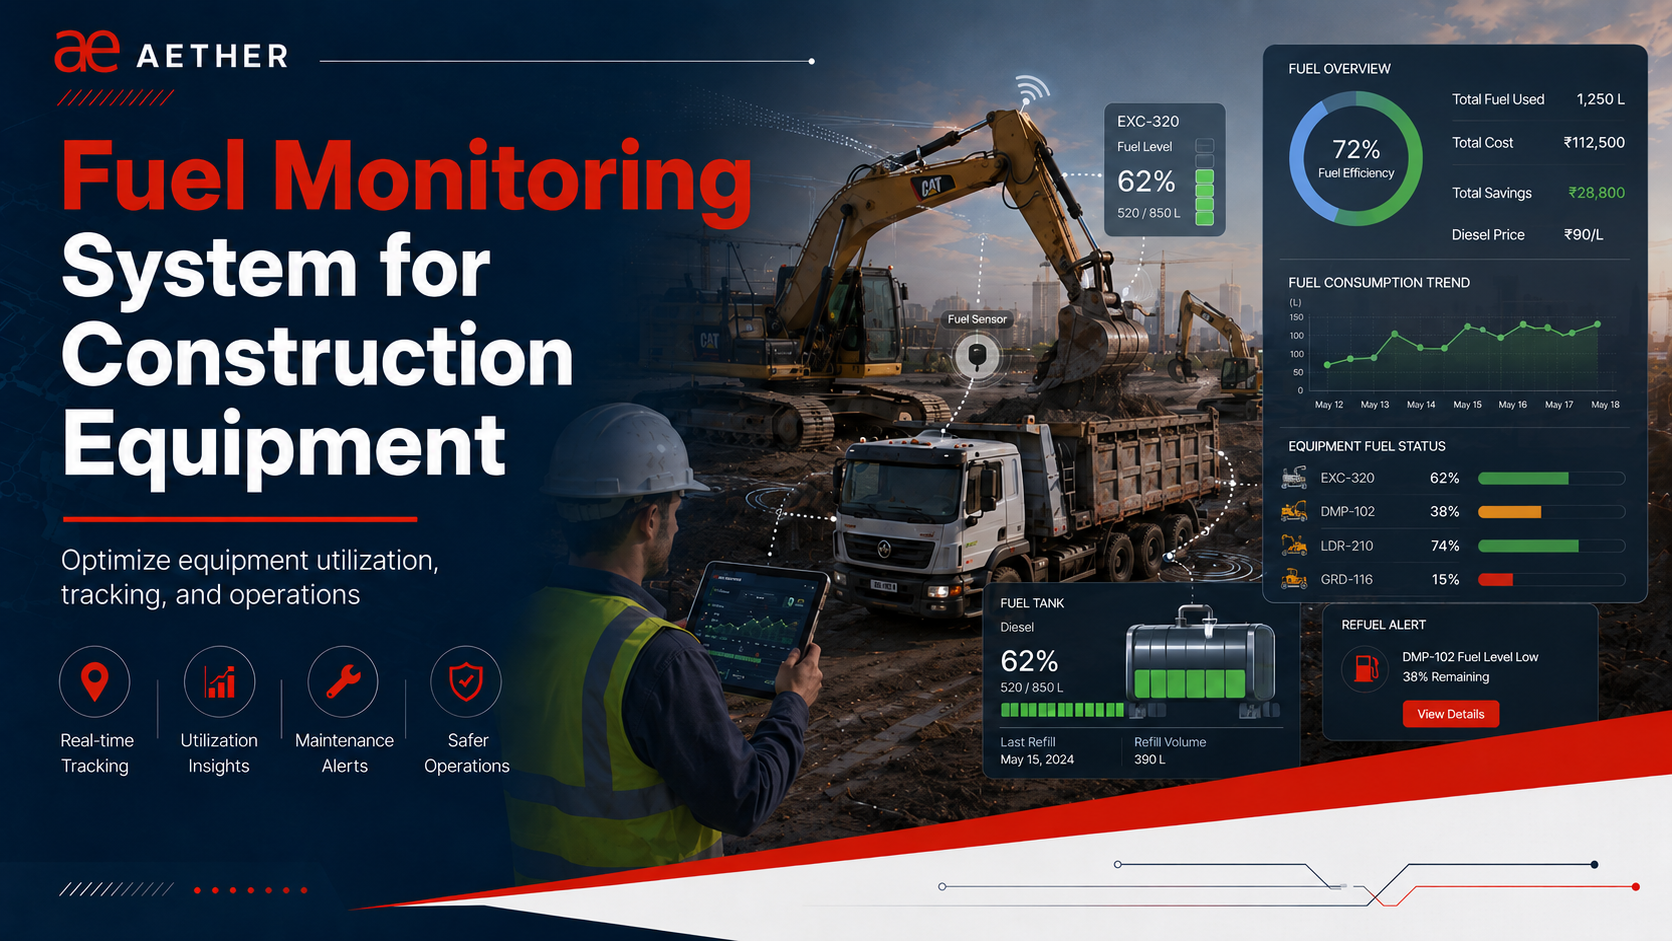
A fuel monitoring system combines three layers: a fuel-level sensor inside the asset tank, an onboard telematics unit that transmits readings, and a cloud platform where events are reviewed and reported.
It is different from fuel dispensing systems at site bunks. Dispensing systems control what leaves the nozzle. Equipment-level fuel monitoring tracks what is actually inside each machine tank in real time, whether the engine is running or not.
For construction operations, the system must continuously detect:
- Refuelling events and net tank increase.
- Consumption trends during operation.
- Draining patterns during non-operational windows.
- Data gaps that create blind windows for manipulation.
- Mismatch between recorded issue quantity and sensor-confirmed tank increase.
In short, it is not just a measurement tool. It is a control layer for one of the most manipulated cost lines in project operations.
Why Vehicle Tracking Alone Does Not Control Diesel Loss
GPS tracking and basic telematics are necessary, but they are not sufficient for diesel control.
Tracking tells you where the asset was, when ignition changed, and how long it moved. It does not tell you the fuel level inside the tank. Without that measurement layer, teams cannot reliably answer:
- Was fuel actually refuelled into the tank?
- Did tank level drop while engine was off?
- Did consumption spike beyond expected LPH/KMPL during operation?
- Was a mismatch created between manual logs and actual tank behavior?
The right approach is integration, not substitution. GPS, engine-hours, and ignition context improve fuel analysis, but only if a fuel sensor + telematics hardware setup provides the primary measurement.
Digitization vs Digitalization: Why This Difference Matters on Site
Many vendors deliver digitization: a sensor, a dashboard, and alert notifications. That is useful, but it is still only the first stage. Digitalization is different. It means the data is operationalized into daily reviews, reconciliation decisions, debit workflows, and escalation routines.
In practical terms, digitization gives visibility. Digitalization gives control.
That distinction explains why two deployments can use similar hardware but produce very different outcomes. One team receives hundreds of alerts and still cannot enforce accountability. Another team receives fewer, higher-confidence findings and can actually execute corrective action.
When evaluating vendors, this is the key test: are they selling dashboard access, or are they helping your team build an evidence pipeline that survives confrontation?
Why Most Fuel Monitoring Deployments Fail to Deliver Results
Many EPC organizations are on their second or third fuel-monitoring vendor. Sensors are installed, data appears on screen, and yet diesel loss continues. The root cause is usually not the concept of monitoring itself, but the missing enforcement workflow around it.
Failure mode 1: Alert overload without evidence ranking
When every fluctuation creates an alert, teams quickly lose confidence. If a high share of last month's alerts were dismissed as noise, today's genuine event is likely to be ignored too.
Failure mode 2: No verification path between alert and action
Operators and supervisors challenge weak alerts immediately. Without timestamped context, engine-state validation, and reconciliation support, escalations stall and the system becomes a passive observer.
Failure mode 3: Operator behavior adapts faster than threshold rules
Sites often see a predictable progression. Early-stage large drains get replaced by smaller sub-threshold events. Later, diversion shifts into operation-time over-consumption patterns that static thresholds miss. Systems that do not evolve from threshold alerts to behavioral analysis are easy to bypass.
The lesson is clear: the value of monitoring is not in data collection volume. It is in decision quality and enforceability.
Where Diesel Actually Disappears on Construction Sites
Fuel loss is rarely a single event. It is a process leakage spread across multiple handoffs. Understanding those handoffs is the first step to reducing repeat loss.
Stage 1: Distribution from bunk to assets
Mismatch can begin at issue time: quantity recorded in manual logs or dispensing records may not fully reach the target asset.
Stage 2: Fuel inside the asset tank
This is the highest-risk stage. Draining can happen during parking windows, shift overlap, or low-visibility hours. In mature sites, operators may move to lower-volume patterns to stay under alert thresholds.
Stage 3: Consumption during operation
Not every theft pattern appears as an obvious sudden drop. Some appear as persistent over-consumption against baseline LPH/KMPL norms, especially during return-line diversion patterns.
Stage 4: Logsheet and reconciliation
Manual records can hide discrepancies through delayed entries, wrong asset tagging, inflated usage entries, or incomplete reconciliation between issue quantity and tank increase.
A robust fuel-monitoring workflow anchors Stage 2 with sensor truth, then cross-checks Stages 1, 3, and 4 through reconciliation and evidence-backed reporting.
The 7 Types of Fuel Loss Construction Teams Need to Track
Instead of treating all exceptions as one drain alert, use this quick classification matrix.
| Type | How It Appears | What to Verify | Typical Action |
|---|---|---|---|
| Standard draining | Sharp drop, often engine OFF | Shift, location, maintenance window | Classify and escalate |
| Sub-threshold draining | Repeated small drops | Pattern recurrence over days | Watchlist + threshold tuning |
| Return-pipe diversion | High operating-time consumption | LPH/KMPL variance vs baseline | Deep operational review |
| UIT gap event | Offline gap + lower restart level | Expected usage vs post-gap level | Residual unexplained volume flag |
| Suspicious pattern | Abnormal but incomplete proof | Evidence confidence | Track, do not over-accuse |
| Refuelling mismatch | Issue quantity > tank rise | Tagging, timestamps, split fills | Reconcile before approval |
| Logsheet manipulation | Entries diverge from telemetry | Hours, fuel, usage fields | Audit + process correction |
Why Verification Matters Before Action
Detection flags risk; verification decides action. This keeps both evidence quality and team credibility intact.
How a Fuel Monitoring System Verifies Refuelling Mismatch
A mismatch case usually starts with a simple question: if site records show 200 liters issued, why does the tank show only a 165-liter net increase?
Good verification does not jump straight to blame. It tests the full chain:
- Was the right asset tagged in the issue entry?
- Did timestamp windows align between issue log and sensor timeline?
- Was the fill split across multiple entries but recorded as one?
- Is the sensor calibration current for that tank geometry?
- Do location and engine-status context support the recorded event?
Only after non-theft causes are ruled out should diversion be classified. This discipline protects teams from false accusations and builds credibility when real leakage is found.
How Fuel Graphs Help Identify Suspicious Patterns
A fuel graph is the visual timeline of tank behavior. Teams should be trained to read patterns, not just alerts.
Pattern A: Drop while engine is OFF
High-priority event. Validate with shift logs, site security movement, maintenance notes, and operator assignment.
Pattern B: Repeated micro-drops
Often missed by threshold-driven alerts. Strong indicator of learned evasion behavior.
Pattern C: Consumption above asset norm
Compare current LPH/KMPL against historical baseline for similar work profile, terrain, and workload.
Pattern D: Reporting gap + lower restart level
Estimate expected runtime consumption during gap and compare to actual post-gap level. Excess gap is a quantified risk signal.
Pattern E: Refuel rise below issue quantity
Treat as reconciliation exception until verified with logs and context.
Why Automated Alerts Alone Usually Fail in Construction
Alerts indicate possibility. Operations decisions need proof.
On site, alert disputes are immediate: rough terrain, sloshing, delayed entry, reporting lag, or sensor fluctuation. Some reasons are valid. Some are not. Without a verification layer, every alert becomes a debate and no corrective action sustains.
The operational difference is simple:
- An alert says something may have happened.
- A verified report says what likely happened, why the conclusion is supported, and what action can be taken.
Need Faster Fuel-Control Outcomes?
If your site is stuck in alert disputes, we can help you set up a verification-first workflow across tracking, fuel monitoring, and exception reporting.
Fuel Monitoring Priorities by Equipment Type
Excavators and crawlers
Typically high-consumption assets. Priorities: shift-window draining, operation-time over-consumption, and baseline normalization by work type.
Mobile and crawler cranes
Large tank capacity and intermittent utilization create hidden windows for drain events. Priorities: parked-window review and low-frequency high-volume anomaly capture.
Transit mixers
High-frequency refuelling and route cycles. Priorities: issue-vs-tank reconciliation and route/operator variance analysis.
DG sets
Predictable load-linked consumption. Priorities: engine-load-normalized LPH variance and off-hour monitoring.
Tippers and dumpers
Distance and haul-profile sensitive usage. Priorities: trip-level baselines and shift variance by haul condition.
Backhoe loaders and graders
Frequent movement across micro-sites and shared accountability. Priorities: handover fuel snapshots and relocation reconciliation.
Alert vs Verified Report: Why This Distinction Matters
Use this side-by-side view to align teams on what is actionable.
| Signal | Alert-Only View | Verified View |
|---|---|---|
| Fuel drop event | "40L drop at 11:42 PM" | Timestamped event + engine/state context + classification |
| Dispute handling | Debate starts immediately | Evidence path is pre-defined |
| Decision quality | Possible false positives | Higher confidence, lower noise |
| Business outcome | Conversation | Debit/escalation/process correction |
Alerts tell you where to look; verified reports tell you what to do next.
Reports P&M Teams Should Expect Every Week
These are the core reports that convert telemetry into operating decisions.
| Report | Cadence | Owner | Decision Enabled |
|---|---|---|---|
| Draining and refuelling summary | Daily | P&M / Site ops | Immediate exception handling |
| Refuelling reconciliation | Daily / Weekly | Stores + P&M | Approve/hold issue entries |
| Consumption variance | Weekly | Fleet analytics | Find outlier assets/operators |
| Engine-hour and idle split | Weekly | Operations | Fuel waste and utilization correction |
| Verified event pack | As needed | BI / P&M | Debit/escalation support |
| Fleet/site trend summary | Monthly | Management | Control effectiveness review |
If reports are not decision-ready, monitoring remains a dashboard activity instead of a control system. Teams usually solve this by standardizing review outputs in a single dashboard workflow with clear action ownership.
Verification Playbook: Turning Events Into Evidence
Keep verification fast and repeatable with a compact seven-step checklist.
1. Scope event
Lock asset, window, and quantity impact before discussion.
2. Check reporting health
Validate uptime, time sync, and maintenance interference.
3. Add engine/location context
Overlay ON/OFF state, runtime, and movement behavior.
4. Reconcile site records
Match logs, issue entries, and tank movement.
5. Benchmark baseline
Compare against historical asset behavior.
6. Classify confidence
Tag event type and certainty level for fair action.
7. Track closure
Record outcome: debit, SOP fix, maintenance, or watchlist.
Consistency here is what makes audits defensible and operations scalable.
60-Day Site Governance Rollout for P&M Teams
Run rollout in phases so control maturity grows with deployment scale.
| Window | Focus | Deliverables | Success Marker |
|---|---|---|---|
| Days 1-10 | Asset scope + baselines | Top-risk asset list, metadata, initial norms | Clean setup coverage |
| Days 11-20 | Exception hygiene | Severity matrix, ownership map, team training | Lower false-positive disputes |
| Days 21-30 | Reconciliation discipline | Issue-vs-tank closure workflow | Mismatch backlog controlled |
| Days 31-45 | Action protocol | Escalation packs and decision SLA | Faster action conversion |
| Days 46-60 | Stabilize + optimize | Rebased norms, blind-spot register, mgmt summary | Repeat loss trend down |
This cadence prevents the common failure pattern of "data without decisions."
Common Dispute Scenarios and How Evidence Should Respond
Use a standard response matrix so disputes do not derail control actions.
| Claim | Evidence Check | Decision Rule |
|---|---|---|
| "Slope caused fluctuation" | Check sustained net drop vs normal slosh signature | If directional decline persists, keep as active exception |
| "Refuelling was delayed" | Match delayed entry with actual tank rise window | If rise is materially low, hold as mismatch case |
| "Engine was running" | Compare event consumption with baseline LPH | If repeated high variance, escalate operational diversion review |
| "Device was offline" | Validate buffer continuity and post-gap level | Quantify unexplained residual volume |
| "Maintenance activity" | Require timestamped job card and authorization trace | No traceable record means unresolved exception |
Standard evidence rules improve fairness and reduce subjective decision-making.
How Aether Approaches Fuel Monitoring for Construction Equipment
Aether deployments are designed around one operational reality: on-site fuel control fails when evidence quality is weak.
Our approach combines field installation discipline, sensor calibration rigor, telemetry continuity checks, and verification-led reporting through a connected fleet management platform. This allows teams to move from alert-heavy dashboards to action-ready findings.
Hardware and installation quality
Sensor model quality alone does not guarantee reliable output. Construction tanks vary in shape, internal baffling, sediment load, and usable depth. Field-measured calibration per tank is essential. Generic table calibration can produce plausible-looking but systematically wrong data, which later collapses during disputes.
Installation discipline matters just as much: clean mounting, stable wiring, sealed routing, and post-install signal validation reduce false gaps and improve continuity in harsh site conditions such as vibration, dust, and remote network coverage.
For remote sites, local-buffer telematics behavior is critical. When connectivity drops, data should be retained and synchronized after reconnection so investigations are based on complete history, not live-window fragments.
BI verification layer
A dedicated verification layer bridges detection and management action. Analysts review raw graph behavior, engine state, location context, maintenance notes, reporting gaps, and reconciliation evidence before classification.
Each flagged event is categorized (for example standard drain, sub-threshold pattern, return-pipe risk, UIT gap anomaly, or mismatch case) and attached to clear explanatory notes. This prevents escalation noise and improves cross-functional alignment between P&M, project teams, stores, and finance.
The result is not just an exception log. It is a structured event narrative that can be used directly for review meetings, corrective action, and debit support.
How the workflow runs
- Detect: sensor + telematics capture tank behavior continuously.
- Verify: analysts review graph, engine context, site records, and reporting health.
- Reconcile: issue records are matched with net tank movement.
- Report: findings are classified and shared in usable operational format.
- Act: project and P&M teams execute debit/escalation/process correction.
- Optimize: baselines improve and leakage windows shrink over time.
Hardware quality, calibration discipline, and post-install support are all critical. A sophisticated dashboard cannot compensate for poor installation or unverified outputs.
Once leakage control stabilizes, the same data starts creating second-order gains: tighter fuel norms, lower idle-time burn, better utilization planning, and earlier maintenance intervention. That is when fuel monitoring transitions from loss prevention to operational intelligence.
Questions to Ask Before Choosing a Fuel Monitoring Vendor
- Which exact sensor model is used, and how does it handle sloshing noise?
- Is calibration done per tank on site or only by generic model table?
- What verification step exists between alert generation and final report?
- Can the system reconcile issue records against tank-level increase?
- Do you provide sample verified event reports, not only dashboard screenshots?
- How is remote-site support handled when devices go offline?
- What SLA and root-cause process exists for repeated reporting gaps?
- How are false positives filtered before escalation?
- How are baseline norms established for different asset classes?
Operational KPI Framework: What Leadership Should Review Monthly
Leadership should track a compact KPI set tied to control quality, not dashboard volume.
| KPI | Definition | Why It Matters | Watch Threshold |
|---|---|---|---|
| Verified vs detected volume gap | Difference between flagged and adjudicated loss | Reveals verification throughput quality | Persistent wide gap |
| Reconciliation closure rate | % mismatches closed in SLA | Prevents aging exceptions | Falling week over week |
| High-risk asset recurrence | Repeat exceptions per asset | Targets supervision effort | Concentrated repeat offenders |
| Offline exposure hours | Total missing-data hours | Measures control blind spots | Rising outage trend |
| Consumption variance | Deviation from baseline | Finds diversion/inefficiency risk | Sustained unexplained drift |
| Action conversion rate | % verified events leading to action | Tests decision bottlenecks | Low conversion despite high confidence |
| Exception aging profile | Open cases by age bucket | Signals accountability health | 30+ day bucket growth |
These KPIs quickly show whether monitoring is truly reducing leakage.
Detailed Equipment Risk Playbook by Operating Window
Different equipment classes need different checks. Use this compact playbook.
| Equipment | Primary Risk Window | Check to Run | Escalation Trigger |
|---|---|---|---|
| Excavators | Shift transitions | Engine-off drop + baseline variance | Repeated unexplained drift |
| Crawler cranes | Standby/parked intervals | Low-activity tank movement review | High-volume overnight exceptions |
| Transit mixers | High-frequency refuel cycles | Trip-cluster issue-vs-tank match | Operator/route outlier recurrence |
| DG sets | Weekend/off-hour runtime | Load-normalized LPH check | Sustained load-adjusted variance |
| Tippers/dumpers | Haul profile shifts | Versioned baseline by phase | Mismatch after baseline refresh |
| Backhoe/utility | Shared usage windows | Handover fuel snapshot discipline | Recurring unassigned losses |
Class-specific checks reduce both blind spots and false accusations.
What Good Implementation Documentation Looks Like
Documentation quality determines whether teams can defend findings during audits and disputes. At minimum, every critical exception should have a compact evidence pack that can be understood without technical translation.
- Event summary: asset, timestamp window, quantity delta, event type, confidence level.
- Graph capture with annotated start/end markers and stabilization notes.
- Engine and location context in the same time window.
- Reconciliation status with issue records and any pending clarifications.
- Classification rationale and recommended action owner.
- Closure status with final disposition date.
Consistent documentation standards reduce ambiguity between operations, finance, and project teams. They also reduce dependence on specific individuals because evidence quality is standardized at source.
Implementation Anti-Patterns to Avoid
Use this quick Do/Don’t view to keep rollout quality high.
Do
- Roll out by risk tier, not full fleet on day one.
- Revalidate calibration after major tank/wiring work.
- Measure success by verified outcomes and closure speed.
- Integrate fuel review with runtime/utilization context.
- Assign explicit owners and SLA for open exceptions.
- Train teams on SOP and evidence handling.
Don’t
- Confuse high alert volume with strong control.
- Treat calibration as a one-time checkbox.
- Run fuel monitoring as an isolated dashboard stream.
- Let unresolved cases age without escalation.
- Rely on verbal explanations without traceable records.
- Skip adoption planning after hardware installation.
Strong implementations combine instrumentation, analytics, process discipline, and field ownership.
Frequently Asked Questions
Can a fuel monitoring system be installed on older construction equipment?
Yes. Fuel-level sensor deployments do not depend on modern CAN/OBD access. Older assets can be monitored with tank-level instrumentation and telematics integration.
Does this work for DG sets and other stationary equipment?
Yes. Stationary assets are often easier to baseline because load-linked consumption can be modeled more consistently.
How long does installation usually take per asset?
A full installation with calibration typically takes a few hours per asset, depending on tank condition, routing complexity, and site access constraints.
What happens if connectivity drops on remote sites?
Industrial telematics devices generally buffer data locally and upload once connectivity returns, allowing historical reconciliation even when live view was interrupted.
Can the system detect theft during engine operation?
Yes, but detection depends on baseline-aware analysis. Operation-time diversion usually appears as abnormal consumption rather than a simple drain alert.
How is this used in debit-note workflows?
Teams use timestamped, classified, and verified event reports as supporting evidence during reconciliation, debit, and escalation discussions.
Getting Started: A Practical Rollout Pattern
Most teams get faster outcomes by starting small but disciplined.
- Start with the top 10 high-consumption or high-risk assets.
- Use the first month to establish asset-wise baseline norms.
- Integrate reports into existing daily and weekly review cadence.
- Define SOP for verified-event confrontation and escalation before first debit.
- Scale only after process maturity is visible, not just after hardware install.
The most reliable success metric is not number of sensors installed. It is the number of verified exceptions that resulted in corrective action.
Summary
A fuel monitoring system for construction equipment only delivers value when it creates enforceable control, not just data visibility. GPS and alerts are useful inputs, but they are not the final output.
What moves cost outcomes is verified reporting: detection, context checks, reconciliation, classification, and evidence-backed action. That is how P&M teams reduce repeat leakage, improve diesel accountability, and strengthen site-level decision quality.
For most project teams, the breakthrough comes when review meetings shift from opinion-based arguments to evidence-led actions. The exact same data can either create alert fatigue or create accountability, depending on how consistently verification and closure workflows are run.
If you implement only one change, standardize your exception-to-action flow and train every stakeholder on the same evidence rules. Once that discipline is in place, additional analytics and automation deliver much higher value with less friction.
If your current setup produces alerts but no action, the next step is not more dashboards. The next step is upgrading your verification workflow and aligning it with your core fleet software stack.
Need Site-Level Fuel Control?
If your team is dealing with draining incidents, refuelling mismatch, or weak reconciliation confidence, we can help you design a verification-first setup for your projects.
Related Reading

