Fuel monitoring dashboard for draining verification
BI-verified fuel loss detection

Manually Verified Draining Events

Aether combines portal data, raw LLS readings, activity logs, engine status, log sheets, and BI review to confirm fuel draining events with audit-grade evidence.

19,700+ L Draining detected in a single month at a rail project site
₹6+ Crore Confirmed losses detected across multi-site project (4 years)
6 Types Draining classifications covered in BI verification
2–3× More loss exposed when asset reporting compliance improves

Why verified draining analysis matters

High-consumption assets such as DGs, dumpers, excavators, transit mixers, and construction equipment depend on accurate diesel visibility. Aether's AE-BI team validates each abnormal fuel drop so site teams can separate genuine consumption from pilferage, sensor issues, maintenance draining, and tampering.

6
Draining classifications covered in the verification process.
24x7
Portal, graph, engine, GPS, and log-sheet based review.
2-3x
More hidden loss can be exposed when asset reporting improves.
20-80x
Illustrative recovery per rupee invested in BI-driven detection.

Data sources used before confirming an event

The attached process document is clear on one point: a graph drop alone is not enough. Aether uses portal telemetry and customer records together so the final event is defensible.

Aether Portal

Machine telemetry and sensor evidence

After the LLS is installed and provisioned, the portal provides the live data needed to identify and validate fuel movement.

  • Fuel level graphs with time-based LLS readings.
  • Raw sensor data for exact before-and-after volume checks.
  • Activity logs for movement, idle, and stop status.
  • Engine ON/OFF logs and operation windows.
Manual records

P&M and site-side cross verification

Manual inputs help confirm whether the event is genuine theft, planned draining, maintenance activity, or a mismatch caused by hardware reliability.

  • Operator log sheets and daily usage entries.
  • Fuel Dispenser System transaction records for cross-reference.
  • Maintenance, repair, tank cleaning, and planned draining notes.
  • Field remarks during LLS failure or device tampering periods.

End-to-end AE-BI verification workflow

Every event is validated through multiple data sources before it is submitted as a final draining report.

Data collection

Aether Portal fuel graphs, raw LLS readings, activity logs, engine ON/OFF logs, E4E transactions, and customer log sheets are collected for the asset and period under review.

Graph and operating condition validation

The BI team zooms into decreasing slopes, checks idle/running/stop conditions, reviews flat-line corrections, and verifies whether the fuel drop matches engine load.

Consumption cross-check

Observed drops are compared against expected LPH/KMPL, historical norms, maintenance notes, planned draining remarks, and store or P&M records.

Reliability checks

LLS failure, GPS-off windows, ignition wiring problems, blind-zone behavior, and device tampering are identified so false positives are not treated as confirmed theft.

Internal review and delivery

Senior AE-BI members review litres calculation and classification before the final PDF, Excel, or summary report is delivered to the customer.

Draining event classifications

The document defines how Aether separates platform-reported events, analyst detected drops, return-pipe diversion, planned maintenance, suspicious events, and unidentified tampering periods.

Auto detected, manually verified

R&D Draining

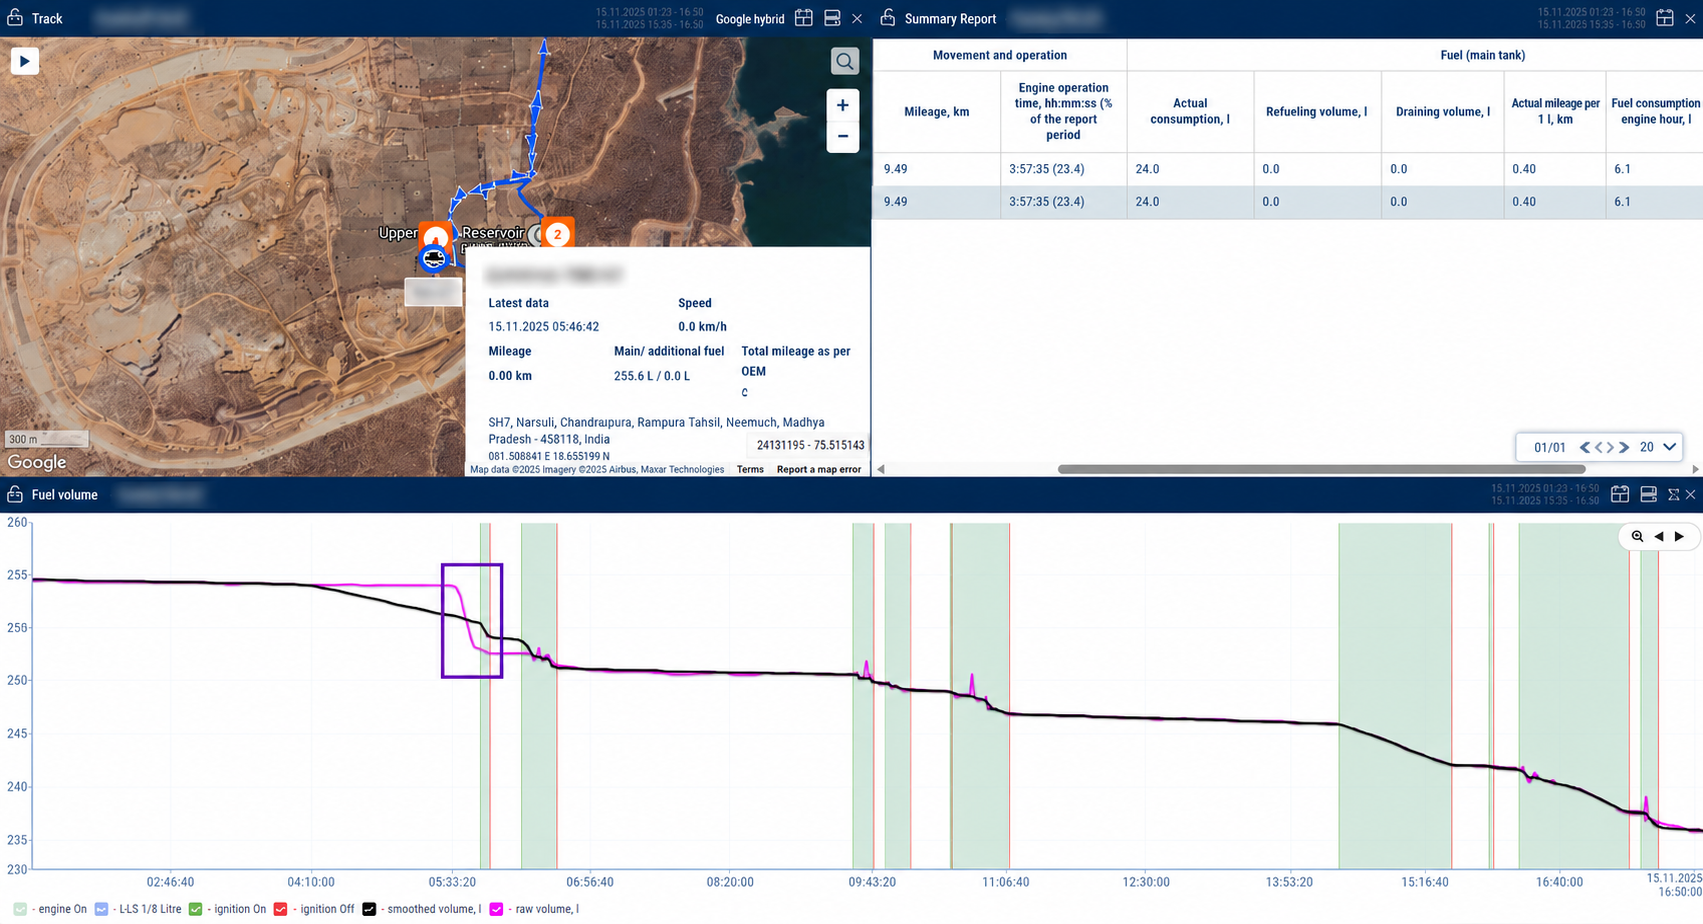
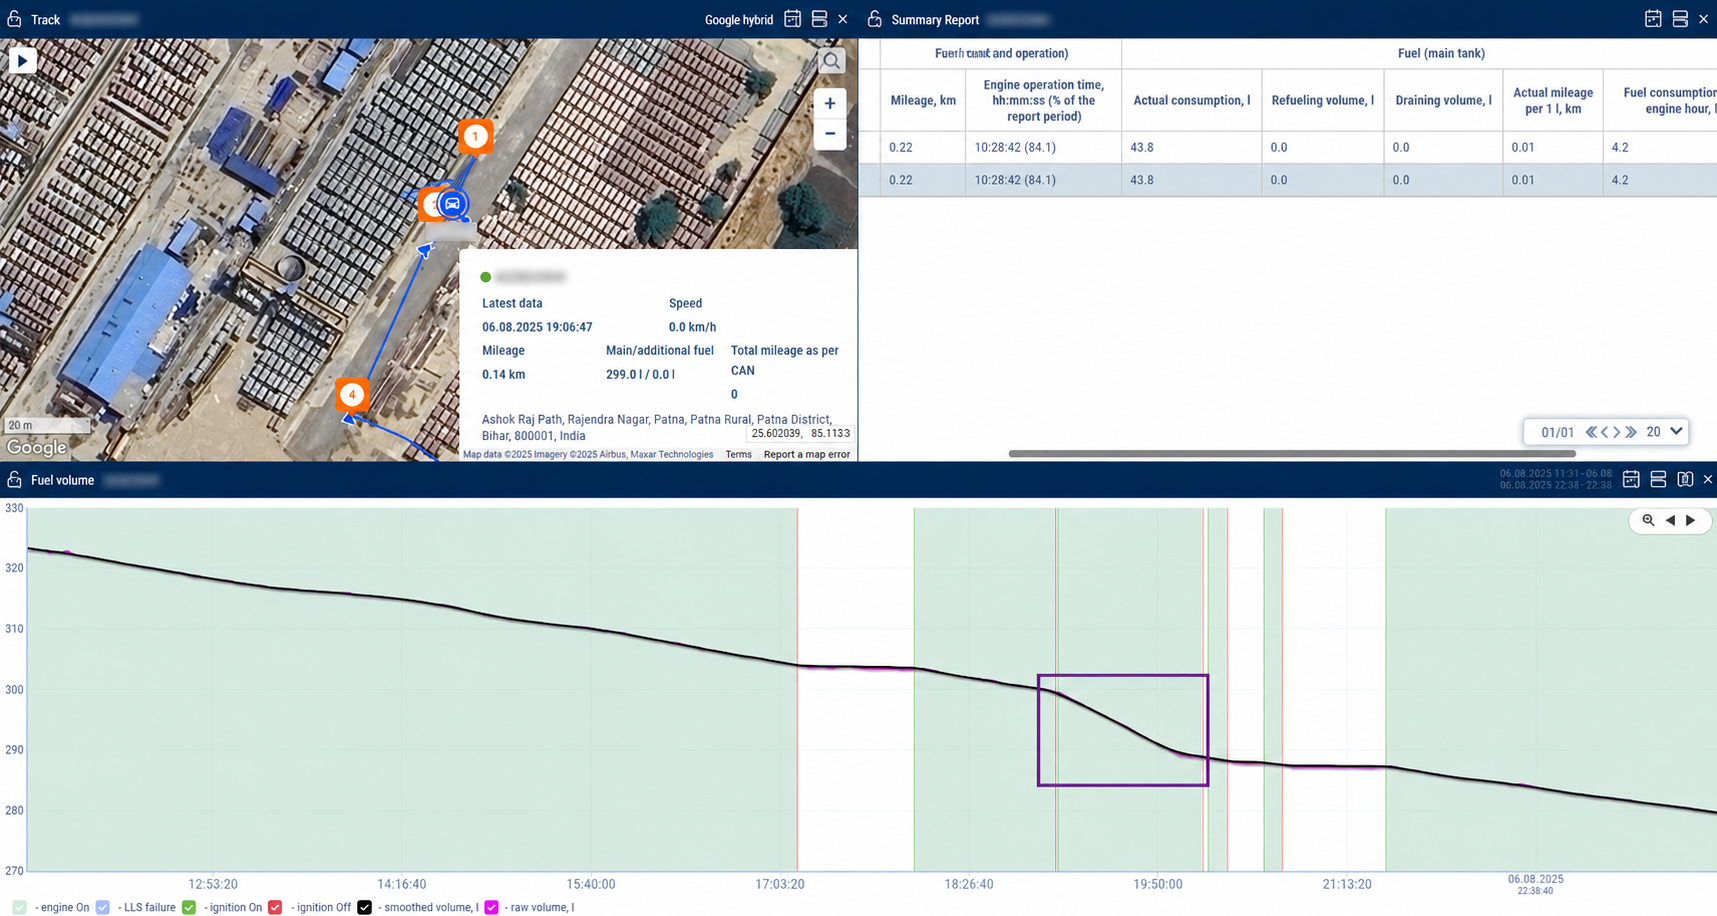
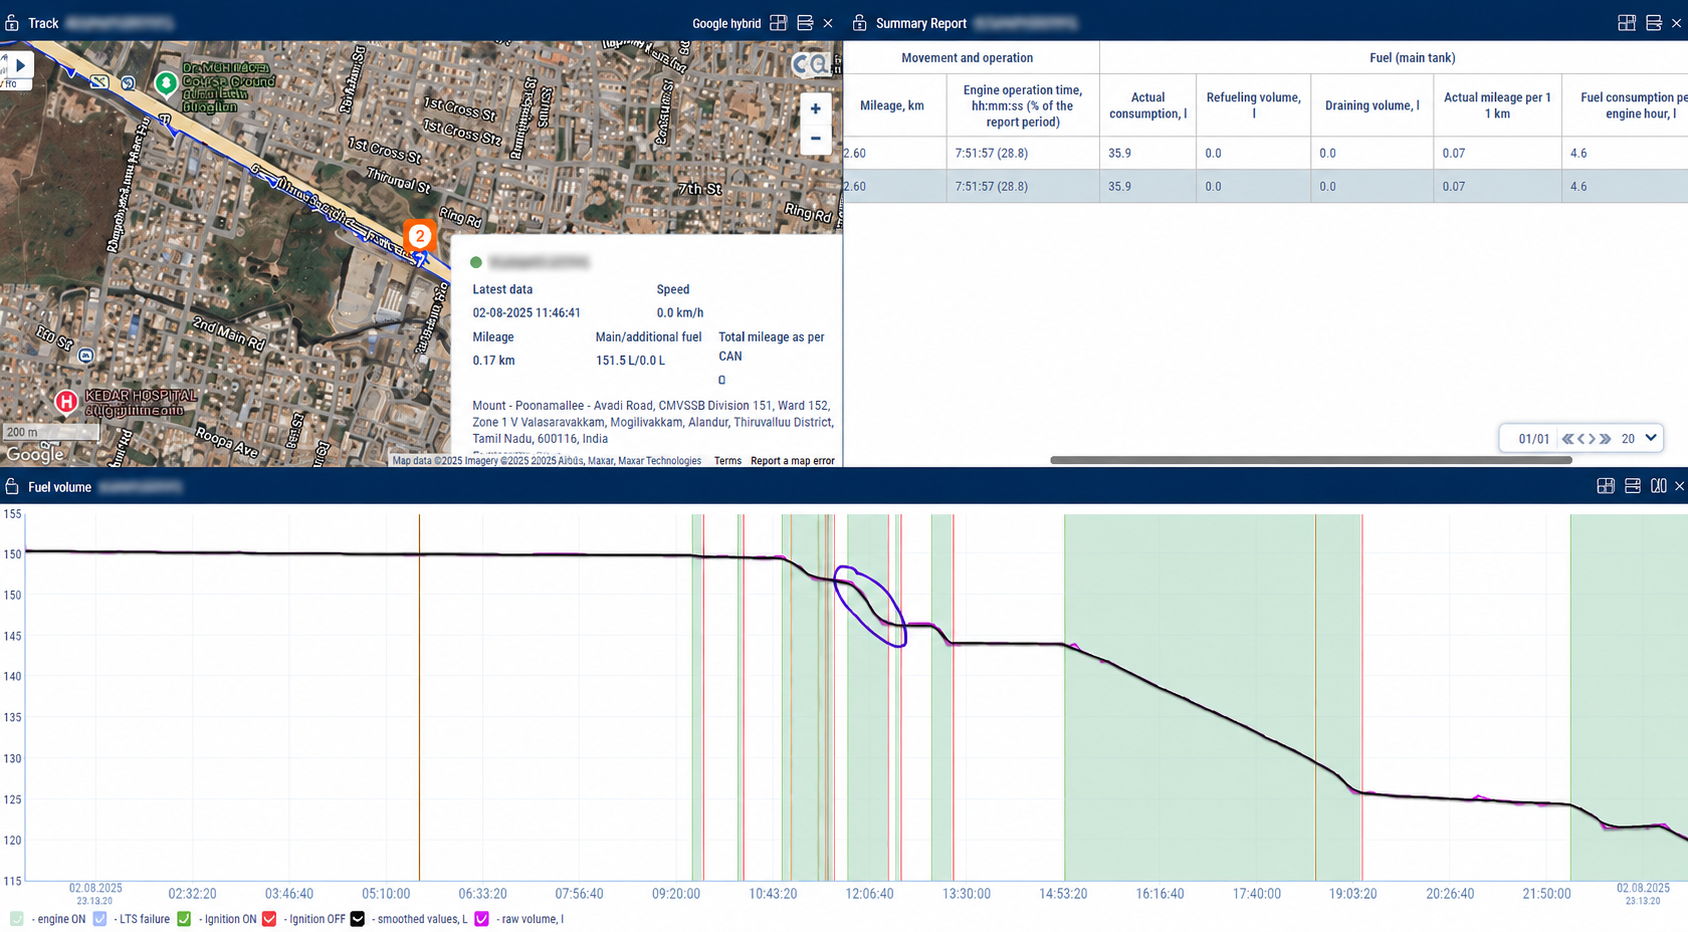
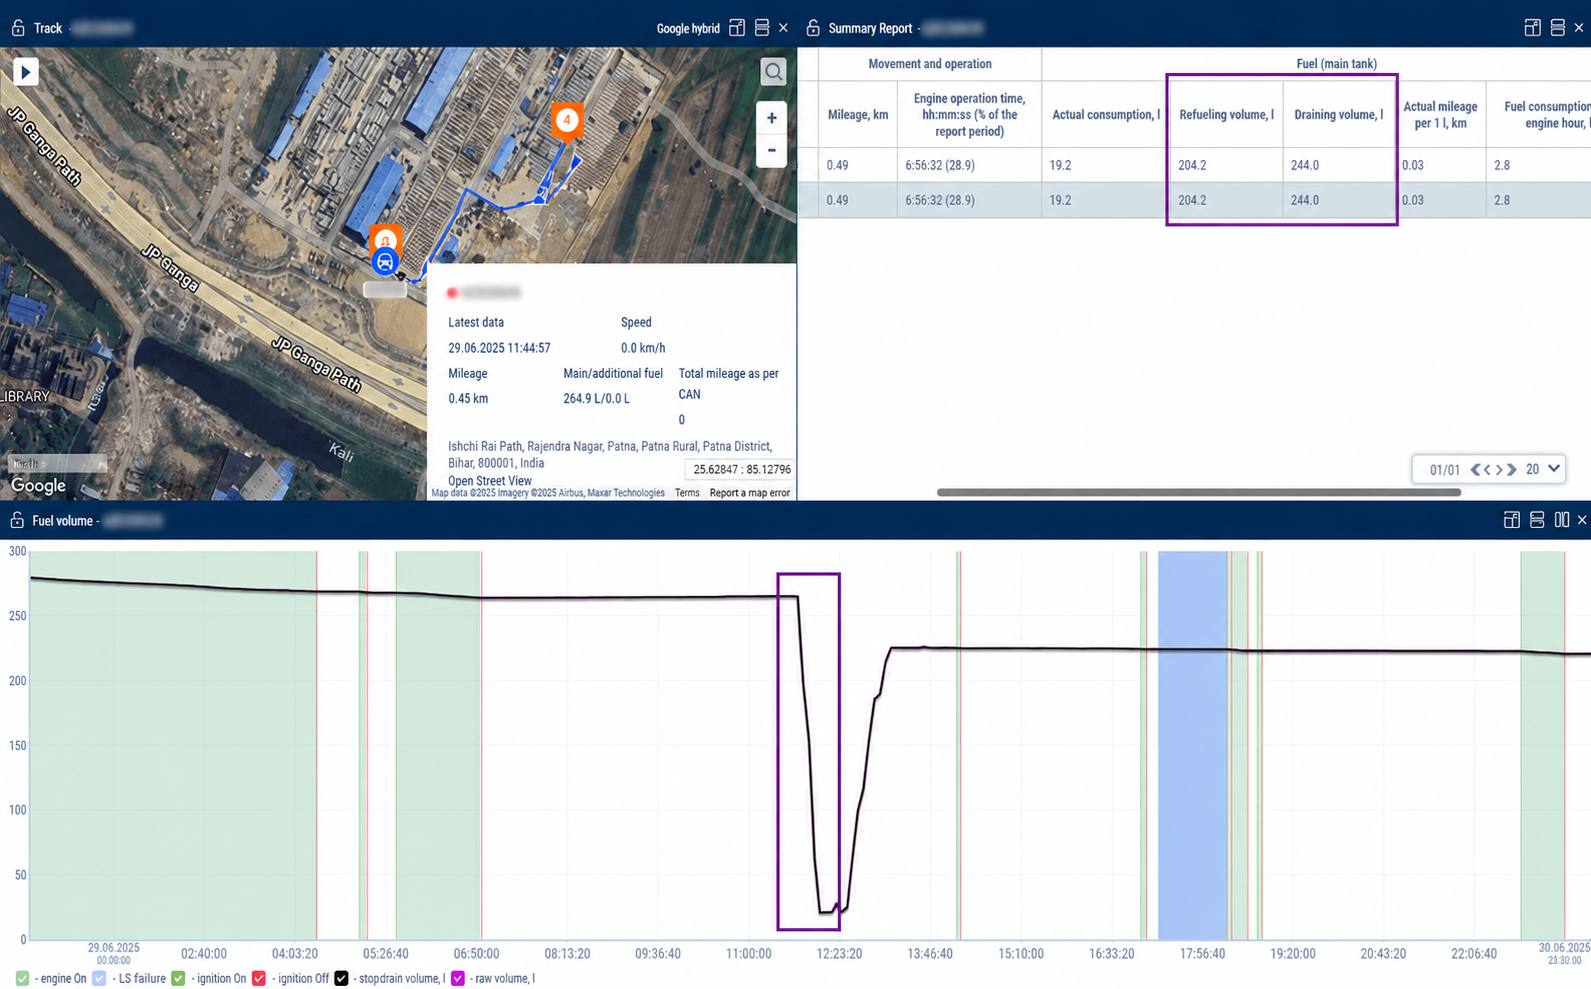
R&D refers to the Refuelling & Draining report generated by Aether. These events are already identified by the platform, but the AE-BI team still checks the graph, raw values, and actual consumption before final reporting.

Verified R&D draining = Actual fuel consumption + Draining volume
Check for slight rise before sudden fall, which may create negative actual consumption in the portal.
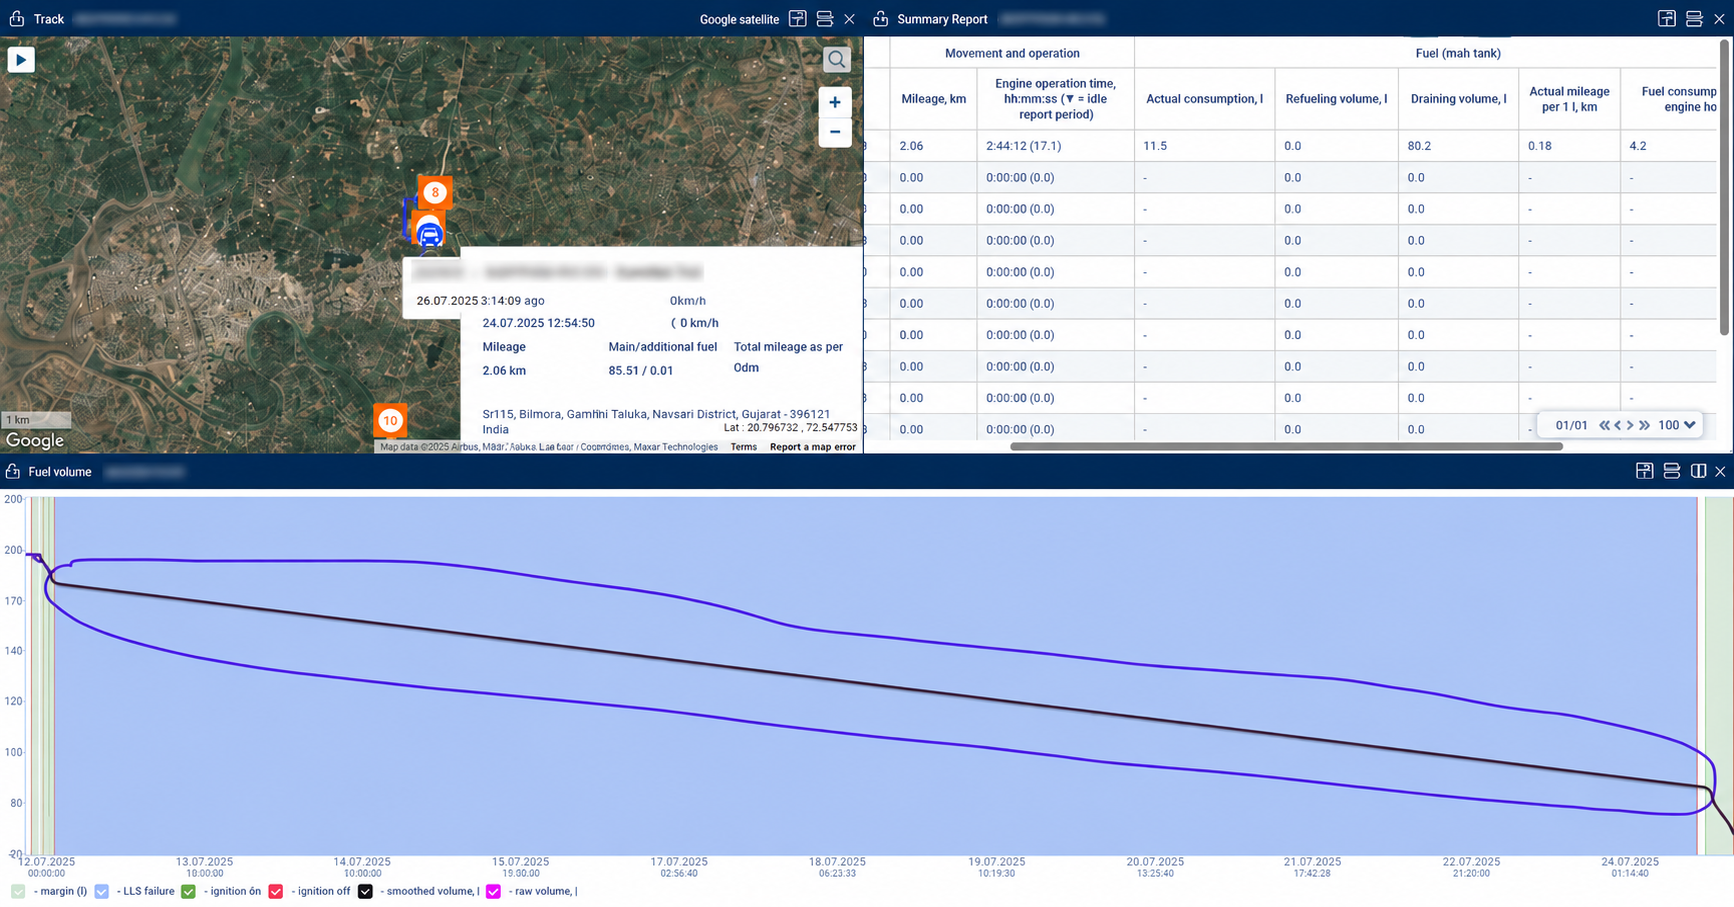
Confirm the event volume from AE Portal against the selected graph window.
Example from document: -2.7 + 24.9 = 22.2 litres, reported as 22 litres.
Aether portal screenshot showing an R&D draining graph and event table
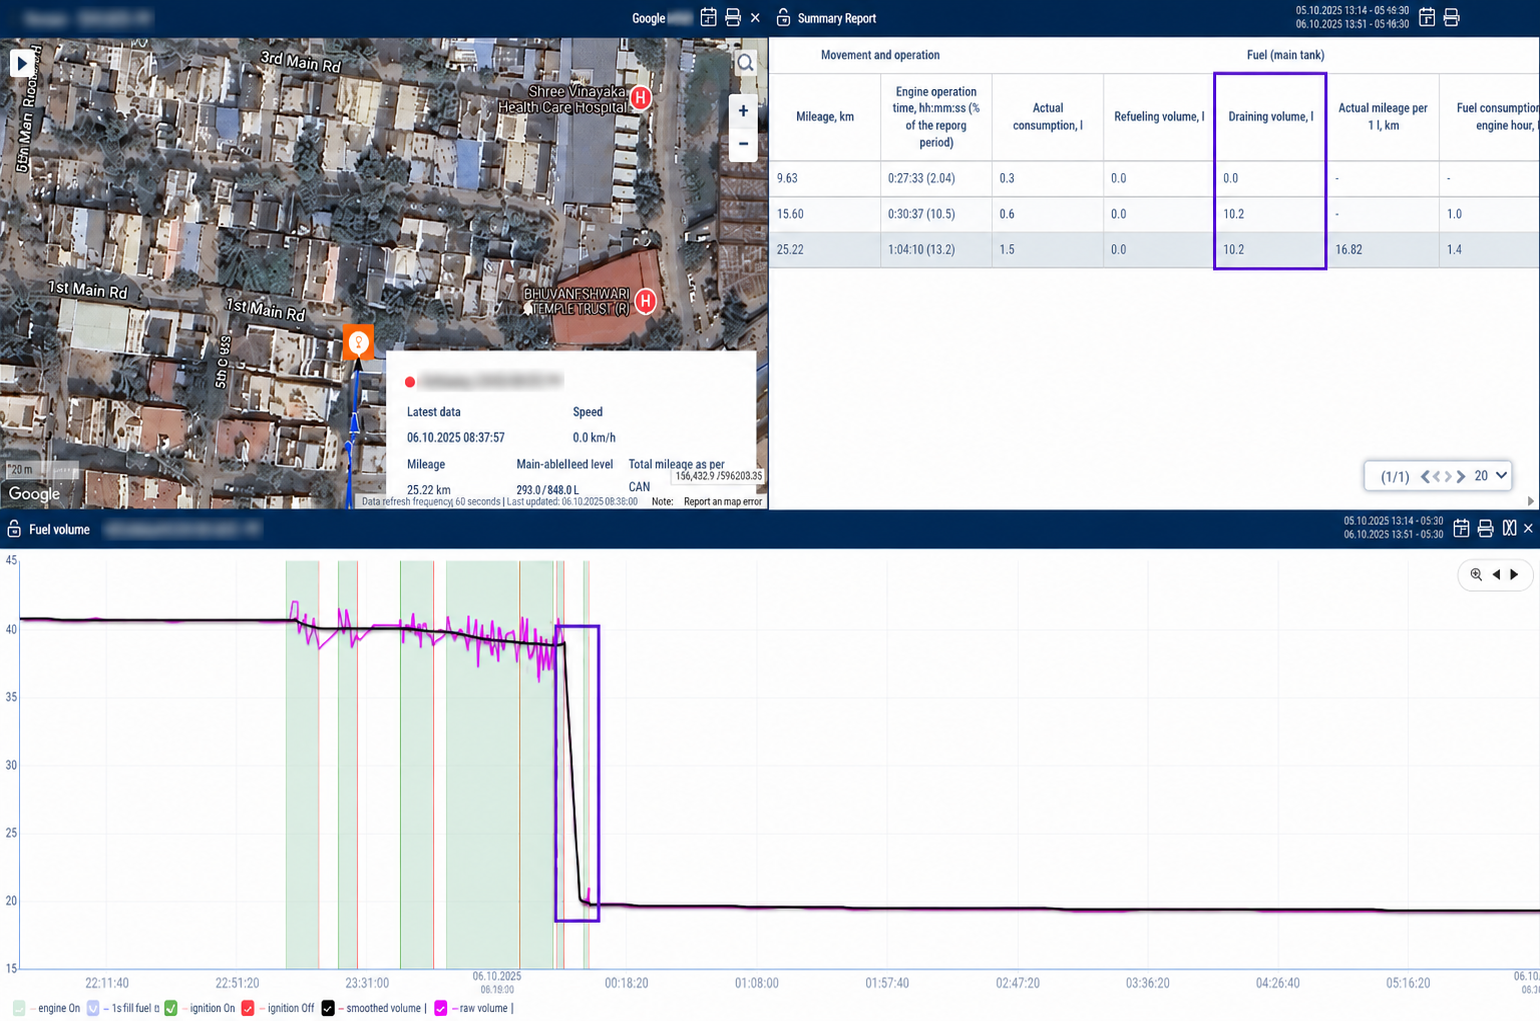
Portal screenshot used to compare event table values with the fuel level graph.
Analyst identified

Manual Draining

Manual draining covers drops that the platform does not report automatically, often because the quantity is small or because the asset was operational during the event.

Manual draining = Initial raw volume before drop - Final raw volume after drop
Zoom into the exact start and end of the falling graph segment.
Check whether the asset was stationary, engine ON, idle, or moving.
Use raw volume readings instead of visual estimation from the graph.
Aether portal screenshot showing manual draining fuel drop during an operating window
Manual event review focuses on the raw before-and-after volume during the highlighted period.
Diversion while running

Return Pipe Draining

This pattern occurs when fuel is diverted from the return pipe while the asset is running. The graph shows gradual abnormal loss, so it must be compared with expected fuel consumption for that asset.

LPH case = Actual consumption - Expected consumption for the running period KMPL case = Actual consumption - (Mileage / Expected KMPL)
Compare the same asset's normal sessions and similar asset categories.
Validate the running duration before calculating expected LPH consumption.
Do not classify as return-pipe draining if GPS-off prevents movement validation.
Aether portal screenshot showing gradual fuel decline used for return pipe draining review
Gradual decline is verified against expected LPH or KMPL before reporting return-pipe draining.
Unusual, not conclusive

Suspicious Draining

Suspicious events are used when quantity is small or fuel readings fluctuate heavily. The BI team flags the behavior, but avoids over-classifying it as confirmed manual or return-pipe draining.

Look for a small rise followed by a sudden drop.
Compare against the fuel norm for that machine category.
Use this classification when evidence is abnormal but not definitive.
Aether portal screenshot showing fluctuating fuel levels used for suspicious draining review
Fluctuation-heavy drops are flagged without overstating certainty.
Known site activity

Planned Draining

Planned draining is done by the P&M team for maintenance, tank cleaning, fuel accuracy checks, or similar operational reasons. These events are documented but excluded from debit action.

Confirm the P&M remark, maintenance note, or planned activity record.
Keep the event in the report for transparency and audit continuity.
Do not mix planned draining with confirmed theft in summary actions.
Aether portal screenshot showing a planned draining review window
Planned events remain visible in the evidence trail but are handled separately in actions.
Unidentified Type Draining

UIT Draining

UIT is reported during LLS or IoT failure periods where fuel may have been removed, but the exact draining method cannot be identified because the monitoring system was blinded.

Total available fuel = Initial volume + Refuelling during tampered period UIT = Projected remaining volume - Final volume after reconnection
Use log-sheet KM, Aether mileage, engine hours, and refuelling data.
Calculate expected consumption by KMPL, LPH, or a combined historical norm.
Document the gap as UIT because the removal method remains unknown.
Aether portal screenshot showing a UIT draining period after LLS failure
UIT depends on reconciliation because real-time fuel visibility was lost during the failure period.

UIT method: log-sheet based

Collect odometer and engine-hour readings during the tamper period, add any refuelling, subtract expected consumption, then compare projected remaining volume with the tank volume after reconnection.

UIT method: Aether telemetry based

When available, use Aether mileage and engine operation time along with E4E/log-sheet refuelling to calculate expected consumption during the LLS failure window.

Reports generated after verification

Final outputs are built for operational action, audit trails, and vendor or site accountability.

Reconciliation summary

Total events, total litres drained, asset-wise volume, and category split across Manual, UIT, R&D, Return Pipe, Suspicious, and Planned events.

Exception alerts

Repeated assets, high-volume events, suspicious behavior, and LLS failure windows that exceed normal duration.

Trend analysis

Frequent draining timings, high-risk locations, daily/monthly patterns, and historical asset behavior.

Evidence pack

Event index table, individual event pages, Aether screenshots, calculation notes, and hardware health observations.

Operational challenges handled by BI review

Manual verification protects the project team from both missed theft and wrong classification by examining each asset's technical health alongside the fuel graph.

Ignition connection issues

An asset may show 4 hrs 11 min of engine operation in the portal, but actual engine run was only 1 hr 10 min — the rest from ignition wiring remaining active. BI identifies this via graph shape (step-line instead of gradual decline) and power supply logs: ~25V for dual-battery systems, ~12–12.5V for single-battery.

LLS blind area

If a sensor records a maximum of 180 L on a 200 L tank, a 20 L blind area is created. Within that zone, actual fuel consumption and draining cannot be measured — identified when the graph shows a flat line during engine operation after a refuelling event.

GPS-off scenarios

When GPS is off, mileage stays at 0 and the track section shows the asset as stationary — even if it ran for 1.5 hrs. Return Pipe Draining cannot be confirmed without valid mileage data. Satellite count below 5 also causes arrows on the map to jump locations, making KMPL validation unreliable.

Aether screenshots comparing graph and log evidence for hardware health verification
Health verification

Why the report includes hardware context

Device health can make the graph look like draining even when the underlying issue is ignition wiring, GPS signal loss, LLS blind zones, or sensor failure. The AE-BI report records these notes so every debit or operational action has context.

  • Power supply logs distinguish actual running from ignition-only reporting.
  • Satellite count and track jumps explain unreliable mileage data.
  • LLS failure windows define where UIT reconciliation is required.

Real-world impact

Case Studies

Verified draining analysis has helped project teams identify large-scale hidden fuel losses that would have gone undetected under standard monitoring.

Large Rail Infrastructure Project — Monthly Spike Investigation

Draining analysis across a multi-asset project fleet

~19,700 L Draining detected in a single month
₹17.75+ Lakh Preventable loss identified that month
20+ Assets Affected by UIT draining events
~19,572 L UIT draining from intentional disconnections

One month recorded abnormally high draining — nearly the entire volume traced to UIT events on trailer assets that were purposefully disconnected from the monitoring system. Manual verification against log sheets confirmed draining across 20+ assets. Debit notes were issued and site monitoring protocols were strengthened following the report.

Large Infrastructure Project Site — Two-Year Draining Summary

Continuous monitoring across 2024–2025

23,000+ L Draining detected in 2024
₹20.84+ Lakh Preventable loss in 2024
4,000+ L Draining detected in 2025
₹24.48+ Lakh Total two-year loss identified

A spike in April was traced to continuous LLS failures across Transit Mixer assets, triggering UIT draining events. R&D, Manual, and Return Pipe draining together accounted for smaller volumes. The two-year reconciliation produced a data-backed basis for LLS reliability improvements and tighter monitoring discipline at the site.

₹6+ Crore
Confirmed losses detected across 22–35 sites over 4 years — with only 30–40% asset reporting compliance.
If reporting compliance reaches 80–90%, detection improves 2–3×. Estimated preventable losses rise to ₹12–18 crore over the same period.

Estimated ROI for fuel draining detection

Aether's BI-driven analysis recovers value that normal monitoring misses — asset disconnections, LLS failures, GPS-off periods, return-pipe diversion, and UIT tampering.

₹30K – ₹2.5L
Monthly savings per monitored site
500–2,000 L
UIT tampering prevention per asset
12%–25%
Reduction in unexplained fuel consumption
₹20–₹80
Recovered per ₹1 invested in BI analysis; ₹100–₹300 in UIT cases

Turn fuel drops into verified, actionable reports.

Our BI team reconciles portal data, raw sensor readings, log sheets, and field context so your team can act on confirmed events instead of uncertain alerts.