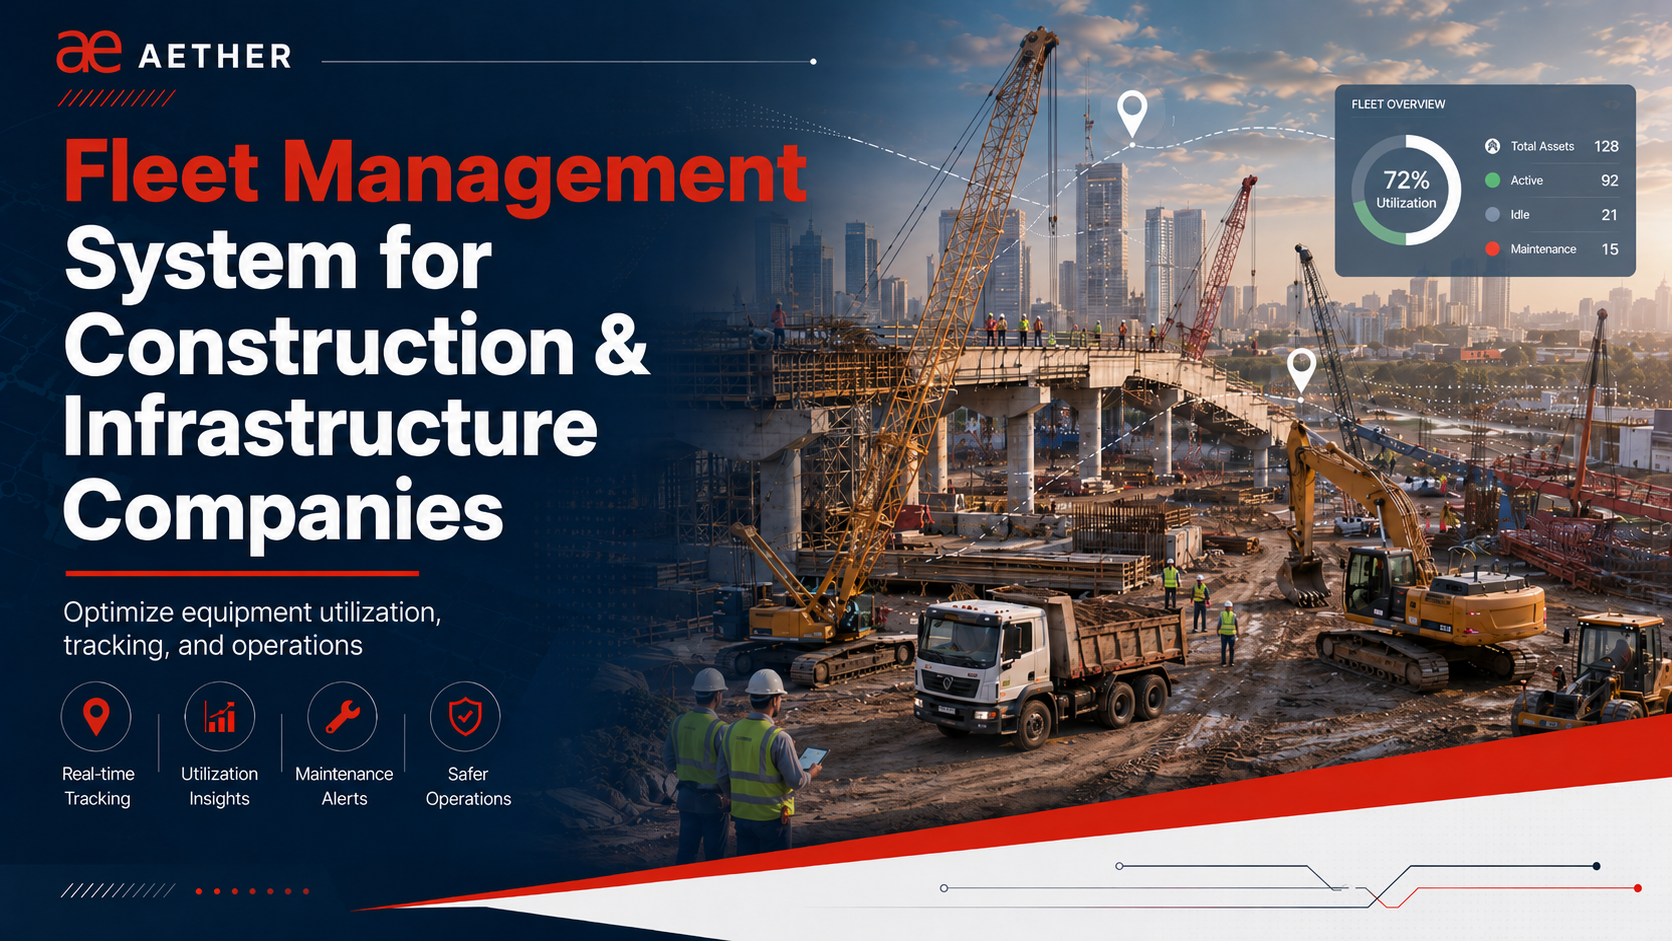
Fleet Management System Challenges
Field reality
Every operation that implements a fleet management system faces challenges that only appear after installation. These challenges are rarely about the technology — they begin when the system starts surfacing data that vendors are motivated to dispute, work around, or ignore.
Understanding these challenges before deployment is the difference between a system that creates real change and one that generates reports nobody acts on.
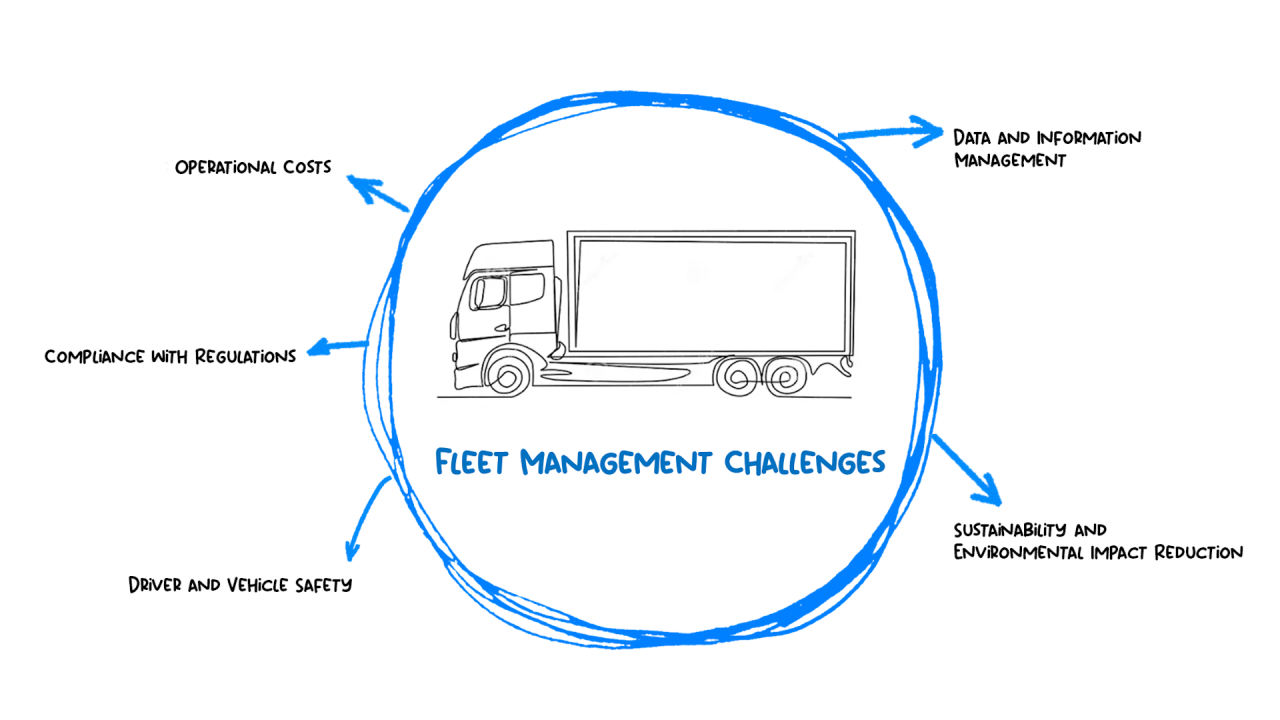
Fleet Management System Challenges: Quick Overview
Fuel Theft
Five distinct methods — each needs a different detection approach. One alert system cannot catch all types.
Resistance
Operators and vendors resist in six predictable stages. The system must be ready for each stage.
Follow-Through
Verified findings need organizational support to create action. Technology alone cannot drive change.
Connectivity
Signal gaps create blind periods that can be exploited. Hardware must store data during offline periods.
Logsheet
Reported hours and kilometres are often overstated. System data must be the primary reference.
Hardware
Cheap devices fail on site and data becomes unreliable. The right hardware determines if findings hold up.
Challenge 1: Fuel Theft Is Not One Problem — It Is Five
The most common assumption is that fuel theft simply means someone manually draining fuel from a tank. On construction and infrastructure sites, fuel is lost through five different methods — each method needs to be detected in a different way.
| Type | How It Happens | Detection Method | Stage |
|---|---|---|---|
| R&D Draining Refuelling & Draining | Tank filled by bowser; fuel drained before shift starts. Loss attributed to normal consumption. | Fuel sensor shows fill followed by immediate drop before engine-on. | Stage 1 — Earliest |
| Manual Draining | Fuel drained while the engine is off or while the asset is parked. The loss gets hidden within normal consumption figures. | Graph review: fuel drop when engine is off. LPH above verified norm without mechanical cause. | Stage 2 |
| Return Pipe Draining | Excess fuel from pump's return line diverted into a jerry can during operation. No sharp tank drop — appears as elevated consumption. | LPH persistently above verified norm. No automated alert fires — requires manual graph audit. | Stage 3 — Advanced |
| UIT Draining Unidentified Type | Operator tampers with sensor or IoT device, creating an offline window. Fuel removed during this blind period — exact method cannot be confirmed. | BI team cross-references last known tank level, engine hours, refuelling records, and ERP data for the offline period. | Stage 3+ |
| False Refuelling | Refuelling recorded in the register but fuel does not reach the machine tank — diverted before filling, or logged against the wrong asset. | Tank sensor shows no rise despite a refuelling entry. Reconciliation against bowser or E4E records confirms the gap. | Stage 2 |
Each type reflects where the site is in its behavioral response to monitoring. R&D draining is Stage 1 behavior. Return pipe and UIT draining are Stage 3. Knowing which type is occurring tells the P&M team what intervention is needed — and what has already been tried.
Challenge 2: Resistance Follows a Predictable Six-Stage Pattern
When a fleet management system is introduced, operators and vendors do not simply accept the change. The resistance follows six detectable stages — and every deployment will pass through some or all of them.
1Ignore
System goes live, ground behaviour unchanged. Draining continues openly. Assumption: another dashboard nobody will act on.
2Discredit
"Sensor is faulty." "Device malfunctioned exactly when the event was recorded." Verified findings — not raw alerts — are needed to win this argument.
3Tamper
Devices disconnected, wires cut. Identifiable because sensors do not randomly go offline during active operation — tampering has its own signature in the data.
4Hack
Shift to return pipe draining — small amounts during operation, below automated alert thresholds. Goal: stay invisible to the system that catches large, sudden drops.
5Delay
Assets kept offline under cover of "maintenance" or "breakdown" — extending the untracked window before compliance resumes.
6Accept or Exit
Operator adapts to the monitored environment — or the vendor relationship ends and the site moves forward with cleaner arrangements.
Each stage requires a different response. Stage 2 requires solid, verified data. Stage 3 requires tamper detection and escalation. Stage 4 requires LPH pattern analysis. A system that only sends automated alerts handles none of these stages effectively beyond Stage 1.
Challenge 3: Findings Without Follow-Through Change Nothing
Most operations are on their second or third fleet management vendor by the time they take this problem seriously. Dashboards are live. Alerts are going out. Fuel is still disappearing. The reason is not the system — an unverified alert never survives a dispute on a project site.
The critical moment in every deployment is when the P&M team confronts an operator about a confirmed draining or hour inflation event. This is not a casual correction — it is an accusation backed by data. The operator resists. The vendor disputes. The P&M team needs two things to win that conversation: data that cannot be argued away, and management that will back the enforcement action.
What readiness looks like
Clear Standard Operating Procedures (SOPs) before the system goes live — defining what happens when fuel draining, KM or engine hour mismatch, false refuelling, or hardware tampering is verified. Deductions applied, penalties for repeat cases, escalation paths defined. Management buy-in before the first finding, not after.
Challenge 4: Connectivity Gaps Create Exploitable Windows
A large portion of Indian construction, mining, rail, and highway projects operate in areas where network coverage is poor or unavailable. When a device loses signal, GPS data stops transmitting. Operators who understand how the system works learn to use these gaps — parking in known low-signal zones to create a window for draining or unauthorized operation.
Good fleet management hardware handles this by storing data locally on the device and uploading when connectivity resumes — showing continuous tracking rather than gaps.
Challenge 5: Logsheet Misrepresentation
Manual logsheets record HMR, KMR, fuel issued, and shift activity. They drive vendor billing, fuel allocation, and productivity reporting. On paper, they appear complete — but they still depend on manual entries made at site level.
Overstated hours are the most common form — machine ran 7 hours, logsheet shows 9. Across a large fleet over a multi-year project, the difference in fuel allocation and vendor billing adds up significantly. Overstated kilometres work the same way for vehicles billed on distance.
Challenge 6: Hardware Quality Determines Whether the Data Is Reliable
India's GPS hardware market has a wide range of devices at very different price points — and many operations choose the cheaper option to reduce upfront deployment costs. On a construction site — dust, vibration, heat, rough terrain, and operators actively trying to disable the device — this decision creates real problems.
Aether uses the Teltonika FMB125/FMC125 IoT gateway for location, engine hours, and data transmission — built for remote and harsh site conditions. For fuel level monitoring, the Omnicomm LLS 4 capacitive fuel sensor achieves up to 99.2% measurement accuracy.
For the solution version of this topic, visit Fleet Management System Challenges. For the full pillar page, see Fleet Management System.
Need verified findings that survive site-level disputes?
Aether helps P&M teams detect fuel loss, validate events, and convert fleet data into action-ready reports.
Related Reading