When the Theft Adapts: Ten Months Inside a Dumper Fleet Diesel Loss
How a construction project moved from unexplained diesel variance to verified events, vendor recovery and a stronger refuelling control process.
The Challenge — consuming more fuel than its work justified
A leading EPC contractor working on a large civil infrastructure project operated a fleet of heavy dumpers on hire — machines supplied and manned by contract vendors, with fuel paid for from the project's own diesel budget.
On paper, control existed. Every machine had a fuel-level sensor and an IoT gateway installed. Every shift ended with a handwritten log sheet: operating hours, kilometres covered, litres issued. Every litre dispensed was signed for.
What the project could not do was tell whether any of it was true.
The first signal was not an alarm. It was an absence: on one dumper, engine data simply stopped arriving. Not a dropout, not a bad SIM — a clean silence. The dumper remained online on the Aether Portal, with GPS and fuel data still coming through.
When the AE-BI team (Aether’s Business Intelligence team responsible for analysing fuel and equipment data) investigated the machine’s history, a second pattern surfaced underneath.
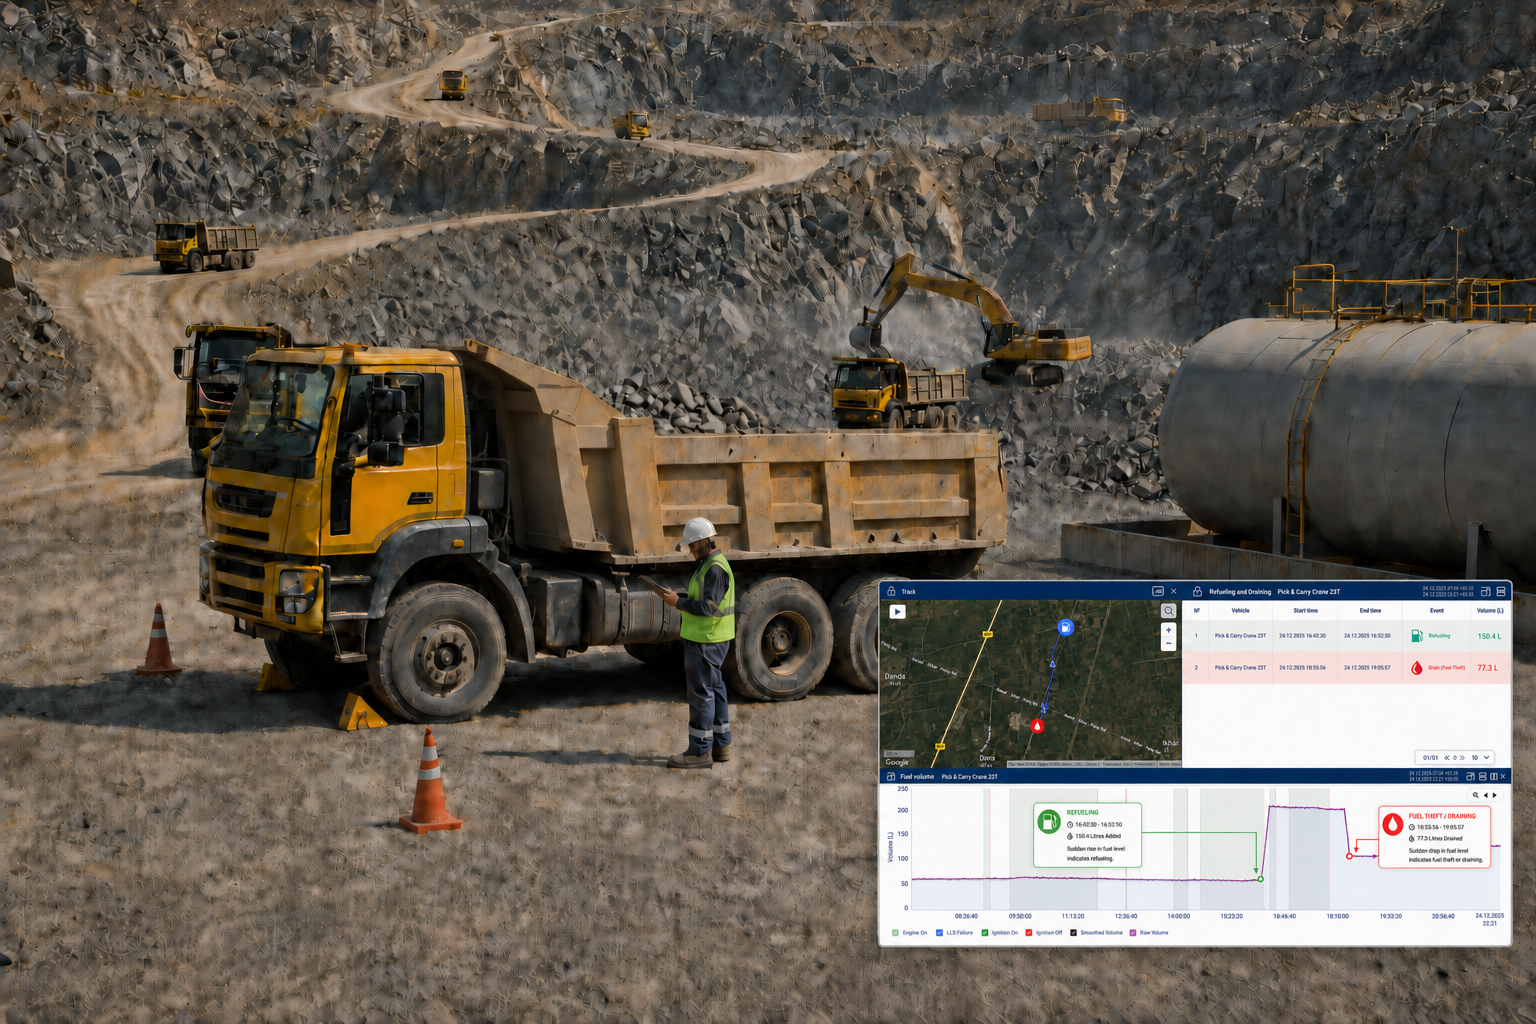
Across three months, that single dumper had bled diesel in 200+ separate draining events totalling 850 litres — and the events were small. Mostly two to five litres at a time, mostly overnight or off-shift, none of them individually large enough to look like anything.
This is the shape of the problem that defeats conventional fleet platforms. Every fuel monitoring system has a threshold below which it will not raise an alert, because below that line sensor noise, fuel sloshing, terrain and temperature. Operators learn where that threshold sits and stay below it. A machine losing four litres a night, three hundred nights a year, never trips a single alarm — and loses more diesel than a dramatic overnight siphon would.
By the time the pattern was assembled, the true extent of the loss was still invisible to everyone except the AE-BI team reviewing the dumper's raw fuel data.
The Investigation — proving fuel theft on a dumper that is expected to consume fuel
Proving diesel loss on a stationary asset, such as a diesel generator, is comparatively simple: the fuel level should only go down when the engine is running. A dumper is a moving asset, so fuel consumption happens as part of normal operation and can vary depending on the load, slope, idling and type of work. Simply saying "this machine used a lot of diesel" is therefore not enough to prove that fuel was being lost.
So the Site P&M (Plant & Machinery) team and the AE-BI team built the case in four independent layers, each closing a different argument the other could not.
Layer one — the missing engine data was done on purpose
An Aether service engineer was deployed to inspect the dumper because its engine data was not reporting. The finding was physical and unambiguous: the RPM wire had been manually disconnected and the fuel sensor connector damaged. This was not a fault; it was an intervention. The engineer fixed the wire connection, and the engine data started reporting again.
Layer two — the same dumper, two very different fuel patterns
Rather than argue about total fuel loss, the AE-BI team ran a like-for-like comparison on the same dumper: five days while draining was active, against five days after the site had intervened.
Five-day window
| Period | Distance | Engine hours | Fuel consumed | Mileage | Consumption |
|---|---|---|---|---|---|
| Draining period | 132.0 km | 38h 21m | 296.6 L | 0.45 km/L | 7.7 L/hr |
| Normal period | 136.9 km | 35h 28m | 165.6 L | 0.82 km/L | 4.7 L/hr |
The two periods involved almost the same amount of work, yet the draining period showed 131 litres more fuel consumed. Mileage nearly halved and hourly consumption increased by roughly 64% — not because the dumper was using more fuel for the work, but because fuel was leaving the tank without being consumed by the engine. At that rate, the dumper was losing about 26 litres of fuel per working day.
This comparison shows a clear fuel-loss pattern on the project's dumper under comparable working conditions. It turns a disputed fuel-loss figure into measurable evidence linked to the dumper's actual performance.
Layer three — the log sheet was inflated to cover the fuel issued
The team then compared the operator's handwritten log sheet with the mileage recorded in the Aether Portal for a single month:
One dumper, one month
| Record | Operator log sheet | Aether Portal — Mileage (KM) |
|---|---|---|
| KM recorded | 2,047 km | 667 km |
A 1,380 km gap — the log sheet showed about three times the mileage recorded in the Aether Portal. Against that inflated kilometres, 2,413 litres were drawn from the project's diesel supply, and 1,378 litres of draining were recorded in the same period. The inflated kilometres were used to justify the fuel issued. Manual records had stopped being a control and had become part of the mechanism.
Layer four — addressing "your sensor is wrong"
Findings like these can be challenged with the same defence: "your fuel data is wrong." So the team tested the fuel data before that objection could be raised.
In a supervised physical verification, the site dispensed a measured quantity into a dumper and the Aether portal recorded it to within a fraction of a litre. A month later, a formal controlled test was conducted across four dumpers in the presence of the site P&M engineer:
| Test fill | Site log sheet | Aether Portal Fuel Data | Accuracy |
|---|---|---|---|
| Dumper A | 83 L | 81.5 L | 98.2% |
| Dumper B | 50 L | 50.5 L | 99.0% |
| Dumper C | 30 L | 29.7 L | 99.0% |
| Dumper D | 100 L | 100.5 L | 99.5% |
Across all four dumpers and 21 refuelling events over a full month, the reconciliation accuracy stayed at 95% or higher. Where the accuracy fell below that level, the team identified the reason — a genuine sensor failure on one dumper, which was rectified on site — instead of counting it as fuel theft.
Credibility comes not only from what you prove, but also from what you refuse to claim without evidence.
The Solution — evidence built to be acted on, not admired
Nothing in this engagement was solved by an alert. The operating model was deliberately different from dashboard-and-alert approach:
- Manually-verified event classification. Every draining event was individually classified by method — manual, return-pipe, sensor-gap, suspicious — and the correct calculation applied per type. Aggregate "fuel loss" figures do not survive a confrontation; classified, itemised events do.
- A monthly reporting process, not a one-off audit. Draining reports were issued every month against every dumper, creating a continuous record rather than a snapshot that could be dismissed as an anomaly.
- Multi-source reconciliation. Sensor data, engine hours, GPS distance, dispensing records and the operator's own handwritten log sheet were cross-referenced against one another. Every source the operator could contest was checked against one they could not.
- A live escalation path. Findings went to the site P&M team with named dumpers, dates and quantities, and a specific request for corrective action — then followed up, in writing, until answered.
- Field service as part of the evidence chain. On-site engineers identified tampering and fixed the affected wiring and validated readings in person, closing the loop between what the data showed and what was physically true on the machine.
The Deployment Journey — ten months, three methods, one arc
What makes this engagement instructive is that it did not end at the first success. It escalated, adapted, and had to be won three times.
Months 1–4 — the theft runs unchallenged
Draining continues on the lead dumper at a rising rate: roughly 169, 378, 303 and 429 litres across four consecutive months — close to 1,280 litres from a single dumper. Reports are issued monthly. No corrective action is taken at site level. This is the most expensive phase of the monitoring process: the data is correct, delivered, and ignored.
Month 4 — the escalation
The AE-BI team formally escalates the issue, attaching the event-level report and the tampering evidence, and asks the site to investigate specific methods including return-pipe interference.
The hire vendor's initial response is to refuse to accept the reports. This is the predictable second move — not denial of the loss, but denial of the evidence.
Month 4–5 — the evidence holds up and the behaviour changes
The controlled draining-versus-normal comparison is produced in direct response to the vendor's rejection. The vendor does not challenge the evidence. The Site P&M team formally notifies the vendor and initiates recovery of the reported fuel loss.
Draining on that dumper stops immediately. Consumption normalises from 7.0–8.0 L/hr to 4.5–5.0 L/hr and mileage recovers from 0.40–0.50 to 0.80–0.90 km/L.
Months 5–7 — three clean months
No draining events. Consumption stays in the normal band throughout. To a conventional monitoring process, this looks like a closed case.
Within weeks the same method spreads from one machine to all four in the fleet.
Month 8 — the theft returns wearing a different mask
Draining does not resume. Instead, losses reappear during the refuelling process itself — the fuel sensor is intentionally disconnected at the moment of filling, so the tank does not record the fuel shown as delivered in the site's refuelling records. Within weeks, the same method spreads from one dumper to all four in the fleet. The AE-BI team reconciles the site's refuelling records with the fuel data in the Aether Portal and identifies 5,010 litres of unexplained fuel loss across the four dumpers over two months, of which roughly 86% is direct draining and 14% occurs inside sensor-blind windows.
The most extreme case needs no interpretation: a log sheet records 216 litres issued to a dumper; while the tank records no fill at all. A 100% discrepancy — the entire quantity, gone before it reached the vehicle.
Months 9–10 — site response stops, and the issue is escalated to HQ
The site team stops responding. The AE-BI team follows up, then follows up again, then escalates above the site to P&M leadership at HQ. That intervention lands: headquarters directs the site to place a P&M engineer physically present at every refuelling, to verify sensor and gateway function throughout the operation, and to involve the on-site Aether technician in the verification. Simultaneously, the Site P&M team confirms that debit notes have been raised against the responsible vendors for recovery.
One continuous journey, the ten months trace an almost clear sequence of operator resistance: tamper with the device, ignore the reports, discredit the evidence, adapt the method when the first route closes, delay the response — and finally accept, once the evidence proves durable and the commercial consequence becomes real. The pattern is not unique to this site. It is a challenge every monitoring programme faces — and many fail to overcome.
The Results — measurable, and verified after the fact
The final-month numbers are the ones that matter. A dumper that had been losing over a thousand litres a month, on paperwork inflated three-fold, closed the period at zero draining, a 28-kilometre log variance, and refuelling reconciled to under 1.3%.
| Outcome | Evidence |
|---|---|
| Draining documented at event level | 200+ events, 850 L on one dumper in three months; ~1,280 L over four months |
| Fleet-wide refuelling-phase loss quantified | 5,010 L across four dumpers in two months |
| Log sheet kilometres inflation exposed | Log sheet 2,047 km vs Aether Portal mileage 667 km — 3× overstatement |
| Manual wire tampering confirmed | RPM wire disconnected, sensor connector damaged; connection restored on site |
| Sensor integrity proven under supervision | 98–100% accuracy, four dumpers, Site P&M witnessed during the test |
| Monthly reconciliation accuracy | 95%+ across 21 refuelling events |
| Draining on the lead dumper, final month | 0 litres |
| Log-sheet-to-Portal mileage gap, final month | 28 km (from 1,380 km) |
| Refuelling reconciliation, final month | 737 L issued vs 727.6 L received — 98.7% |
| Fleet draining status, final month | Three of four dumpers at zero; the fourth explained by a rectified sensor fault |
| Commercial recovery | Debit notes raised against vendors; first vendor acceptance signed and returned |
The Business Impact — from unexplained variance to a recoverable line item
The loss was sized. Across the two documented phases, roughly 6,290 litres of diesel were accounted for as loss on four dumpers. At the diesel rate used in the customer's own recovery documentation (~₹96/litre), that is about ₹6 lakh — from four dumpers, in a fleet that runs many more.
The loss became recoverable, not just visible. This is the step most monitoring processes never reach. A debit note raised against a hire vendor for one month's draining priced the diesel at cost, then added a penalty and an overhead charge before tax — recovering roughly 1.7× the raw fuel value for the quantity lost. It carries the vendor's acceptance stamp. Evidence became a receivable.
The economics invert. Once loss is recoverable, monitoring stops being an IT expense and becomes a way to protect profit directly. Recovery on a single machine, for a single month, at a rate that exceeds the value of the stolen fuel, is a materially different result from "improved fleet visibility."
The behaviour changed — twice. Both times a finding was backed by evidence the vendor could not challenge and a commercial consequence the vendor could feel, the loss stopped on the affected dumper. Deterrence, not detection, is the outcome the project buys.
Governance moved up a level. The engagement ended with HQ P&M mandating supervised refuelling and instrumentation checks as standing site practice. A finding on one machine became a control on a fleet.
Manual records were revealed as a liability. The three-times log inflation and the 216-litre discrepancy show that handwritten shift records were not merely inaccurate — they were the instrument through which the loss was justified. No amount of paperwork discipline closes that gap. Only an independent measurement can close that gap.
Key Takeaways for Infrastructure Leadership
- The theft you can see is not the theft that costs you. Losses can arrive in two-to-five-litre increments below an alert threshold. The real loss comes from frequency, not size — and repeated small losses are easy for automated detection to miss.
- Assume the method will change. Close the draining route and the loss migrates to the refuelling window. Close that and it moves again. A monitoring process designed around one failure mode has a shelf life; a monitoring process designed around an adapting adversary does not.
- Detection without consequence produces nothing. Four months of accurate, delivered, monthly reports changed no behaviour at all. The month a commercial debit was raised, the loss went to zero. Data does not create accountability — enforcement does, and data only has to be good enough to make enforcement safe.
- Your evidence must survive the "your sensor is wrong" defence. It is a common challenge. Address it early with supervised tests in the customer's presence and be equally rigorous about the events you decline to call theft. The exceptions you refuse to claim are what make the rest of the report unarguable.
- Manual log sheets are a control only until someone has a reason to inflate them. Three-times overstatement in the log sheet went unnoticed until an independent measurement existed to compare against.
- Escalation is part of the product. The site stalled. The monitoring process worked because someone kept writing until headquarters answered — and headquarters changed site practice. Analytics that stop at the report boundary stop short of the outcome.
Need to verify diesel loss across hired equipment?
Aether combines fuel sensing, GPS and engine data with event-level reconciliation and site follow-through.
More Fuel Accountability Stories