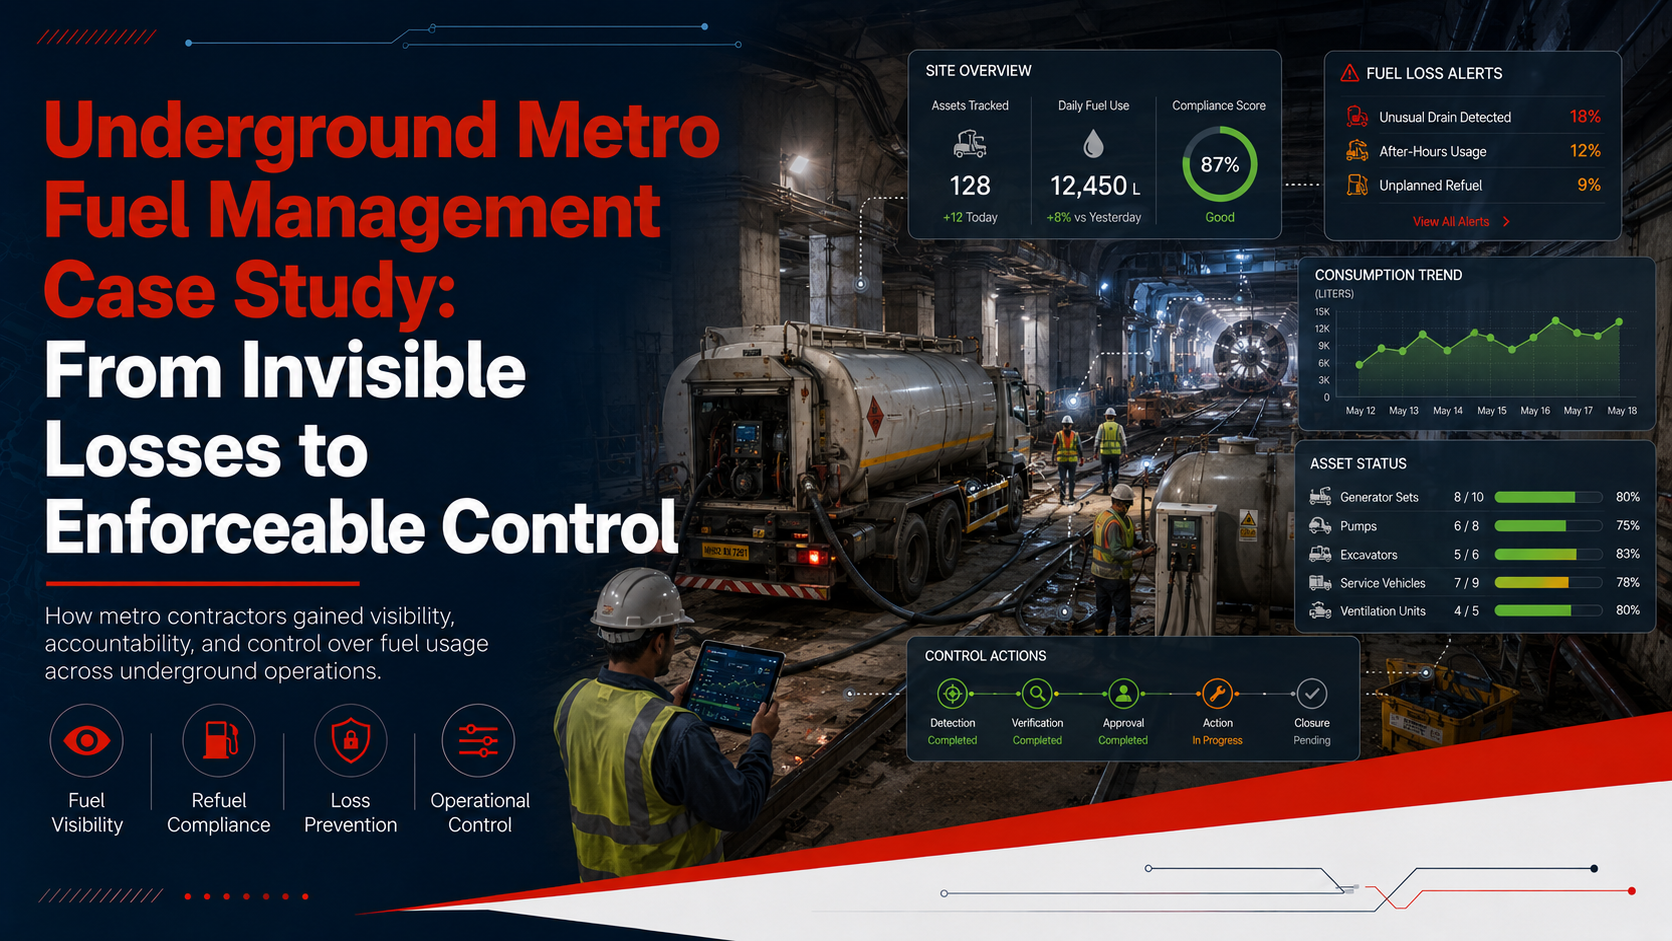
Transit Mixer Fuel Optimization: From Fuel Loss to Fuel Control at a Metro Project
At a large metro construction project, 32 Transit Mixers were running across every shift. The site had ERP records and manual fuel logs, but none of it could answer the one question that actually mattered: was the diesel being consumed by operations, or was it being lost through theft and manipulation?
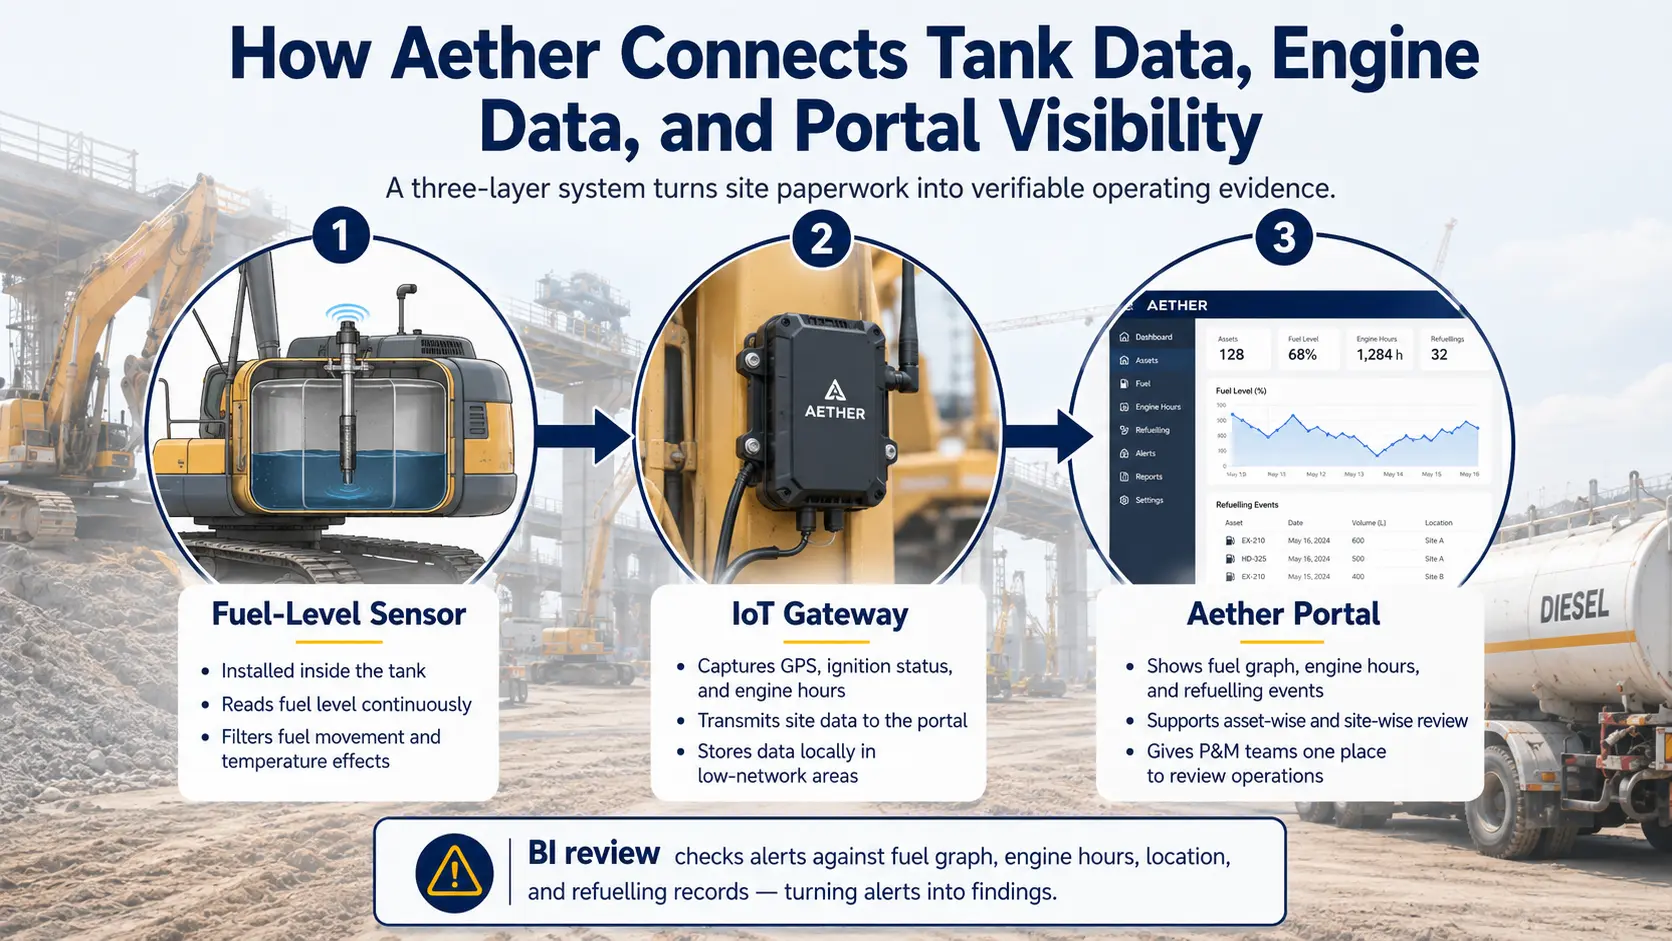
Aether Fleet and Fuel Management System was installed across the fleet. What followed was not just theft detection. It was an end-to-end investigation, correction, and control process that changed how the site operated.
32
Transit Mixers deployed
400+ L
Detected draining in one TM, one month
3.2 -> 2.8
LPH norm corrected
32 -> 24
TMs now enough for same work
The Starting Problem
The fuel norm was built on inaccurate operating-hour data, and it was hiding the real picture
Before any theft could be measured accurately, there was a more basic issue. The site's fuel consumption benchmark, the norm, was set at 2.8 LPH using engine hours from EIP, the site's internal reporting system. EIP hours were not precise enough for fuel-norm calculation. For the same vehicle in the same month, EIP logged significantly more running hours than Aether portal showed, a gap of over 100 hours in a single month. Every LPH figure built on top of EIP became unreliable because of it. Based on EIP data, the site's fuel norm was set at 3.2 LPH, a figure that looked acceptable but was built on inflated hours.
Take one TM from March 2024 as an example. It was issued 1,300+ litres of diesel that month. Aether detected 400+ litres of draining from that vehicle. When the deduction was applied using EIP hours, the LPH came down to a figure the vendor immediately said was not operationally feasible. They were right. But the problem was not the deduction. The problem was the wrong hours behind it.
The accurate clean baseline, after correcting the hours and removing the detected draining, came to approximately 2.83 LPH. The site had been holding operators to a benchmark that was not built on real data. That had to be fixed along with everything else.
How It Unfolded
Four methods. Four detections. No blind spot found.
Once the system was active, the BI team started seeing patterns that did not match normal operation. What followed was not one incident. Each time the site intervened, the approach changed.
01. Direct draining, caught by fuel level patterns
Operators were draining fuel directly from the tank. On the Aether portal, this shows up clearly: a sharp fuel level drop during a period when the engine was not running, or right at the start of a shift before meaningful operation had begun. No consumption justifies that kind of drop.
This was not limited to one vehicle. Multiple TMs across the fleet were showing the same pattern, same timing, same signature. The BI team compiled these incidents and reported them to the site P&M team. Total draining across the fleet in this phase ran into several hundred litres. The site took action. Direct draining incidents came down. Then the pattern changed.
02. LLS tampering, caught by sensor anomaly patterns
After direct draining was detected, operators shifted focus to the fuel level sensor itself. By tampering with the fuel level sensor, they could generate false readings. The idea was that if the sensor data is incorrect, any alert raised from it can be dismissed as a sensor issue, not theft.
But tampering creates its own pattern. Sensors do not randomly disconnect and reconnect during active operation, or show abnormal drops that did not match every other data point for that shift. The BI team identified the anomaly, reported it clearly, and the site team acted again.
03. LLS fully disconnected, caught via ERP cross-referencing
The third attempt was the most direct: disconnect the fuel level sensor completely. No sensor data meant no fuel-level visibility, and no fuel-level visibility meant no draining alert. On paper, it looked like a genuine blind spot.
Aether's verification does not depend on a single data source. When sensor data was gone, the BI team cross-referenced Aether portal running hours against the site's own ERP fuel dispensing records. The logic is simple: if a vehicle was issued X litres, ran for Y hours at a known consumption rate, and its tank was empty well before those numbers would predict, something else is taking the fuel. The report held up completely, without a single sensor data point. Site team was informed. Action taken.
04. Refueling record manipulation, caught by reconciliation
With post-fueling theft blocked and the sensor tampered with, the approach shifted again, this time to the refueling records themselves. Operators started recording more fuel as filled than was actually put into the tank. Inflate the filled figure and the LPH looks high but explainable; the stolen margin disappears into what looks like consumption.
Aether ran a refueling reconciliation: comparing the quantity shown as filled in the records against the actual change in tank level, adjusted for running hours and consumption. If records show 180 litres filled but the tank only went up by 120 litres, that 60-litre gap is visible and traceable. It was. Reported. The site acted, and after this action the manipulation stopped.
Need Site-Level Fleet Control?
If your team is seeing fuel loss, idle-time waste, refuel variance, or utilization gaps, Aether can help map the right fuel monitoring setup for your sites.
Financial Exposure
What the draining actually cost
For the one documented TM example from March 2024, approximately 400 litres of draining was detected in a single month. At Rs 90 per litre, that is approximately Rs 35,000 from one vehicle in one month. Across 32 TMs running continuously, the exposure adds up quickly.
4,000+ L
Total detected draining across all TMs
Rs 3,50,000+
Total financial impact at Rs 90/litre
The larger financial impact is not only the theft of diesel. Eight fewer Transit Mixers means lower vendor billing, fewer daily refueling cycles, fewer operators to manage, and less maintenance overhead, for the same concrete output.
Norm Correction
From a number no one trusted to one the site could actually use
The fuel norm correction is what made the results stick. Catching theft matters, but if the benchmark itself is built on wrong data, there will always be a dispute. The vendor was right that 2.2 LPH was not feasible. The problem was not the deduction. The problem was that EIP hours were inflated, which pulled the LPH figure down and hid what was actually happening.
Aether's approach was to recalculate the norm from the ground up using accurate portal data. Three dates in March 2024 had to be excluded because of data gaps caused by tampering. For those days, the BI team applied average running hours based on the rest of the month. After that correction, the clean consumption rate came out to 2.83 LPH. A formal escalation was raised with management, the full calculation was shown, and the norm was revised to 2.8 LPH.
This gave the site a number it could enforce, one that reflected what genuine consumption actually looks like, with nothing hidden inside it.
3.2 LPH -> 2.8 LPH
Norm revised using Aether portal hours. EIP data was inflating the baseline.
The Result
Same work. Eight fewer machines. Lower cost across the board.
The clearest proof that the intervention worked is this: the same concrete supply work that required 32 Transit Mixers is now handled with 24. Eight fewer machines, same output.
This happens because theft distorts operational planning. When fuel disappears faster than it should, vehicles appear to run empty sooner, and the site makes up for it by deploying more machines and scheduling more refueling runs. Remove the theft and correct the norm, and the actual productivity per TM becomes visible, and the fleet size adjusts.
32 TMs -> 24 TMs
Same concrete output. Eight fewer machines deployed. Same work, lower cost.
Fuel loss across the site, quarter by quarter after intervention
- Q1: 2,100+ L, peak before intervention
- Q2: 1,350+ L, about 36% drop after first confrontation
- Q3: 380+ L, continued falling
- Q4: 160+ L, near-controlled state
Transit Mixers were among the highest-risk asset categories during this period. And it was not only TMs. On the same site, one Backhoe Loader separately lost 4,200+ litres, approximately Rs 3.78 lakh on a single asset. The vendor denied it. A physical test on site confirmed the portal data was right. That is the kind of accountability this system creates.
Final Takeaway
Fuel loss at this scale does not happen in one go. It happens in small amounts, across many vehicles, using whatever gap is currently invisible. The reason this case worked is not that Aether had one powerful alert. It is that when each method was tried, a different layer of the system caught it.
Sensor data, ERP records, portal hours, and refueling reconciliation could not all be tampered with simultaneously. Every tactic had a counter. That is what made the accountability stick.
A tracking system tells you where your Transit Mixer is. Aether tells you where your fuel is going.
Want to implement similar controls across your sites?
Explore Aether's fuel monitoring solution or request a demo to audit fuel losses and enforce measurable control.
More Fuel Accountability Stories