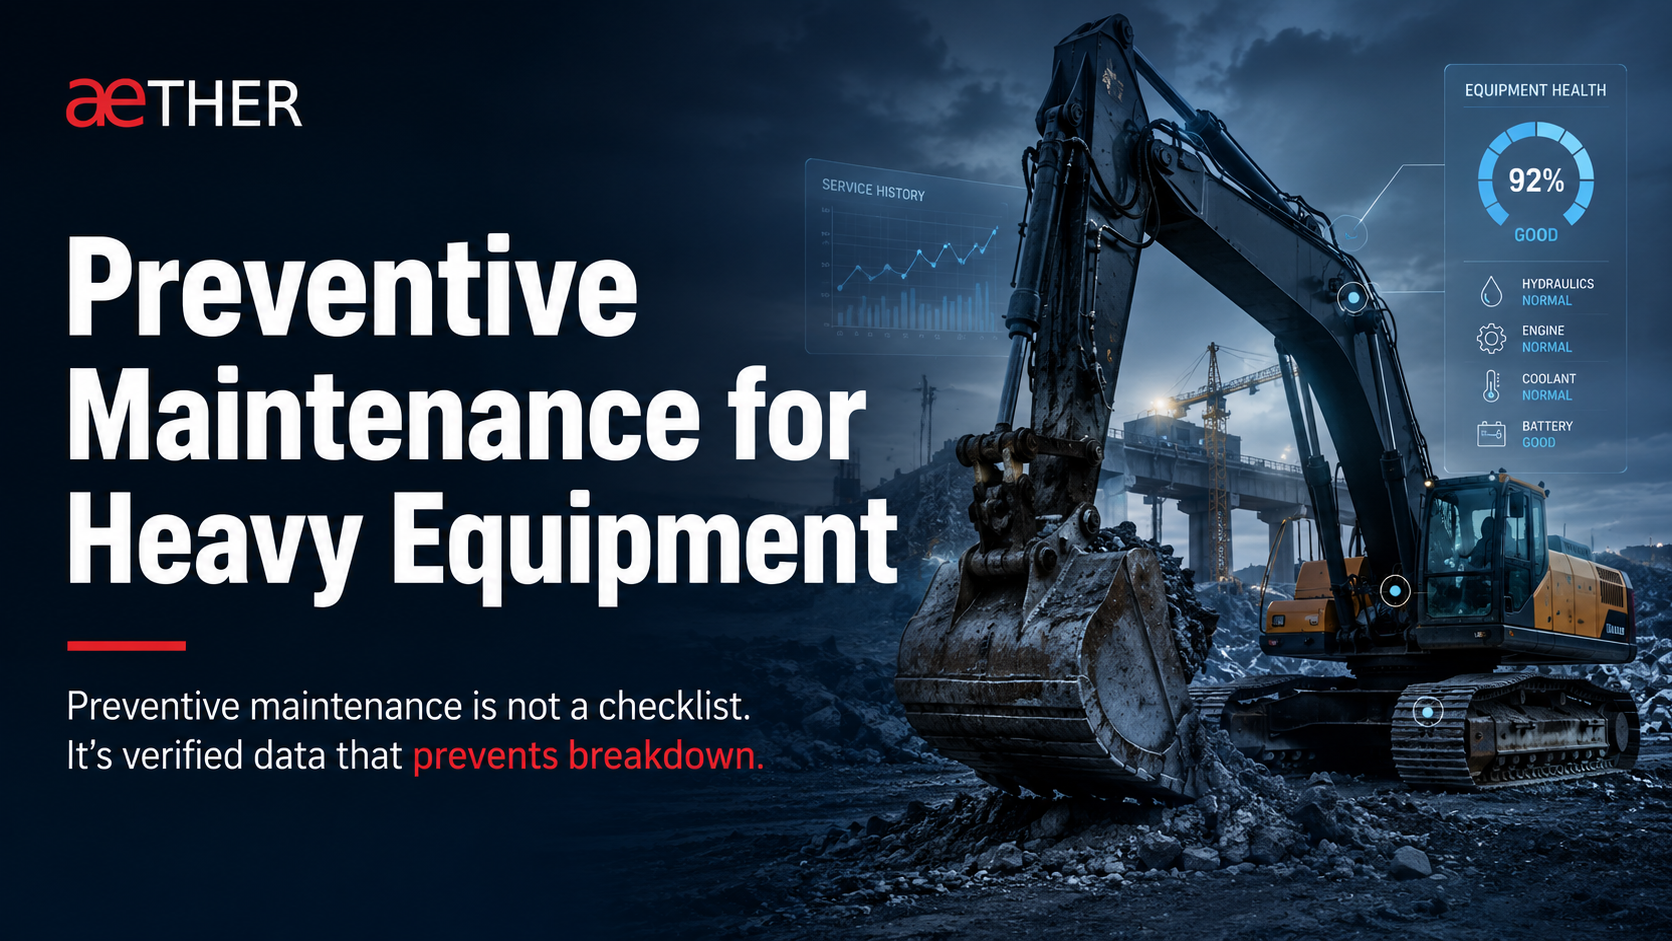
Preventive Maintenance for Heavy Equipment: How to Reduce Downtime, Fuel Waste and Costly Breakdowns
TL;DR
Heavy equipment rarely fails without warning — higher fuel use, abnormal idle hours and delayed servicing usually show up first.
The gap in most maintenance programs isn't the checklist. It's verification: schedules run on self-reported engine hours and self-completed forms — the two inputs that go wrong first.
A strong program treats engine hours, idle time and fuel consumption as verified health signals — not numbers on a logsheet.
Heavy equipment rarely fails suddenly without warning. An excavator that breaks down today may have shown early signs for weeks: higher fuel consumption, abnormal idle hours, delayed servicing, low utilisation, overheating, hydraulic leakage, battery issues, excessive vibration, repeated operator complaints, or irregular engine-hour reporting.
The problem is that most construction and infrastructure sites still treat maintenance as a checklist activity: a machine is inspected, a form is filled, a service date is noted — and a breakdown still happens.
The gap isn't the checklist. It's verification. Most preventive maintenance programs run on self-reported engine hours and self-completed inspection forms — the same two inputs that go wrong first. A checklist only protects you if the hours and observations behind it are actually true.
For EPC contractors, mining sites, road projects, metro sites, hydro projects, quarry operations and infrastructure fleets, equipment downtime isn't just a repair problem. It delays work fronts, increases fuel cost, disrupts project planning, affects billing, and creates conflict between site teams, P&M teams, vendors and operators.
That's why heavy equipment preventive maintenance is moving from basic checklists to data-driven maintenance control — where engine hours, idle time and fuel consumption are treated as verified health signals, not just numbers on a logsheet.
What Is Preventive Maintenance for Heavy Equipment?
Preventive maintenance is the planned inspection, servicing and correction of equipment before failure occurs — for machines such as excavators, backhoe loaders, wheel loaders, dozers, motor graders, compactors, cranes, transit mixers, dumpers, tippers, diesel generators, concrete equipment and refuellers.
A preventive maintenance program usually includes:
- Daily operator inspections
- Scheduled service based on engine hours or kilometres
- Oil, coolant, hydraulic and filter checks
- Greasing and lubrication
- Battery and electrical inspection
- Tyre, track and undercarriage checks
- Brake, steering and safety checks
- Fuel system inspection
- Breakdown history review
- Service record documentation
But in heavy equipment operations, the most important trigger is often not the calendar date — it's usage. A machine working 10 hours a day in rocky excavation needs a different maintenance approach from one running 2 hours a day for light loading. A DG running under poor load needs different monitoring from one running at healthy load. This is why preventive maintenance has to be built around real operating data, not assumed intervals.
Why Preventive Maintenance Fails on Actual Sites
Most companies already know maintenance matters. Breakdowns continue anyway. The reason usually isn't awareness — it's that the inputs feeding the maintenance schedule aren't verified.
1. Maintenance runs on manually reported engine hours
Operators or supervisors self-report machine hours. Hours get underreported to delay servicing, inflated for billing or fuel claims, mixed with idle hours, or simply logged late. If engine hours are wrong, the entire maintenance schedule built on top of them is wrong.
2. Checklists are filled, not verified
On busy sites, daily inspection forms become routine paperwork — boxes ticked without the machine actually being checked. Minor leaks, abnormal smoke, loose wiring or undercarriage wear go unnoticed until they become major failures. The checklist itself isn't the problem; the absence of evidence behind it is.
3. Fuel data is ignored in maintenance planning
Fuel is usually treated only as a cost-control metric — it's also a maintenance signal. A sudden rise in litres per hour can point to:
- Clogged air filters or injector problems
- Incorrect working mode or engine overload
- Excessive idling or hydraulic drag
- Poor operator behaviour
- Fuel leakage, theft, or diversion
- Wrong machine selected for the job
If a machine normally consumes 4–5 LPH during a defined activity and suddenly consumes 6–7 LPH with no change in work type, that's a maintenance flag, not just a fuel-cost flag.
4. Idle time is treated as a fuel problem, not a maintenance risk
A machine left idling accumulates engine hours without producing output, bringing it closer to its service interval with nothing to show for it. High idle time drives unnecessary engine wear, more frequent servicing, carbon buildup, and a distorted cost-per-hour picture. A machine with 1,000 engine hours but only 600 productive hours has a very different maintenance profile from one with 1,000 hours and 900 productive — preventive maintenance has to separate run hours, idle hours and productive hours to mean anything.
5. Site conditions aren't factored in
OEM service intervals matter, but site conditions decide how aggressively a machine should be monitored — rock breaking, dust, slope, waterlogging and continuous heavy load all shorten the safe interval. A standard checklist can't capture this unless it's adapted by asset type, application and site condition.
The Four Layers of a Strong Preventive Maintenance Program
Layer 1: Daily Operator Inspection
Before start: engine oil, coolant, hydraulic oil and fuel levels; visible leakage; tyres or tracks; battery condition; warning lights; brakes; horn and lights; greasing points; attachment condition; unusual noise or smoke; safety devices.
After the shift, the operator should report anything abnormal — sound, power loss, overheating, fuel use, hydraulic delay, leakage, track/tyre or attachment damage, warning indicators. The goal isn't ticking boxes. It's catching early signs.
Layer 2: Scheduled Maintenance Based on Usage
Service triggers should include engine hours, kilometres, fuel consumed, load conditions, idle percentage, application severity, OEM recommendation and prior breakdown pattern — not just a date on a calendar. An excavator's 250/500/1,000-hour intervals should shorten if it's working in severe conditions.
Layer 3: Condition-Based Monitoring
This layer looks at actual machine health: fuel consumption trend, engine and idle hour trend, overuse or underuse, repeated breakdowns, battery voltage, engine on/off behaviour, and (where available) hydraulic temperature or pressure. Two machines of the same model doing different work will age differently — condition-based monitoring is what catches that.
Layer 4: Digital Compliance and Verification
This is where most programs are still weak. A digital maintenance control system should be able to answer: Did the machine actually run for the reported hours? Was it idle or productive? Was fuel consumption normal for the work performed? Was service completed before the threshold? Was the asset available when the project needed it? This is what turns maintenance from a paperwork process into an accountable operating system.
The Role of Fuel Monitoring in Preventive Maintenance
Fuel monitoring is usually discussed only in the context of theft detection. For heavy equipment, it's also a maintenance indicator — every machine has an expected fuel range for a given activity, and a mismatch is worth investigating.
Fuel-signal maintenance is the practice of using verified fuel consumption data — not just engine hours — as an early warning input for mechanical stress, so that abnormal LPH triggers an inspection before it becomes a breakdown.
A mismatch between expected and actual fuel consumption can point to:
- Wrong working mode or poor operator practice
- Clogged filters or injector inefficiency
- Hydraulic resistance or excessive idling
- Overloading
- Fuel leakage, theft, or return-line manipulation
- Incorrect manual reporting
If an excavator shows unusually high fuel during normal excavation, the cause may be mechanical, not theft. If fuel level drops with no corresponding engine activity, that points to draining. This is the layer most generic maintenance guides skip — fuel data belongs in the preventive maintenance review, not just the fuel audit.
This is the same verified-evidence approach we use for fuel-loss detection — see how drain and refuel events get verified in our fuel monitoring system.
The Role of Engine Hours and Idle Hours
Engine hours decide service intervals, but not all engine hours are equal. Every heavy equipment team should track three separate numbers:
- Run hours — total time the engine was on
- Idle hours — engine on, no productive movement or work
- Productive hours — machine actually doing work
Most maintenance programs only look at total engine hours. If idle hours are high, the machine reaches its service interval faster without producing enough output — raising fuel cost, maintenance frequency, engine wear, and unplanned downtime risk. For construction fleets, the more useful metric isn't maintenance cost per machine. It's maintenance cost per productive hour — because that's what actually reflects asset performance.
For the full breakdown of how idle hours distort fuel and utilisation numbers, see our guide to idle time in construction equipment.
Preventive Maintenance by Asset Type
A single generic checklist across a mixed fleet is one of the most common reasons preventive maintenance underperforms. Focus areas differ sharply by machine:
| Asset type | Focus areas | What to watch |
|---|---|---|
| Excavators | Hydraulic oil and hoses; boom, arm and bucket pins; bucket teeth and cutting edge; track tension and undercarriage; swing motor and slew ring; engine oil and filters | Fuel consumption by work mode — normal excavation shouldn't consume like rock breaking unless site conditions justify it |
| Backhoe Loaders | Front loader arms; rear boom and bucket; tyres and brakes; hydraulic leakage; steering and transmission | Idle time between work fronts and fuel per hour — multipurpose use makes needs vary heavily by pattern |
| Wheel Loaders | Tyres; brakes; transmission; articulation joint; hydraulic system; bucket edge | Cycle fuel consumption during loading — a change is an efficiency issue, not just a cost one |
| Dozers | Undercarriage; track chains, rollers and sprockets; blade condition; hydraulic cylinders; engine load; dust exposure | Undercarriage wear — these repairs are expensive, so check first |
| Diesel Generators | Engine oil; coolant; battery; fuel level; load percentage; runtime; leakage or draining | Long hours at poor load — tie maintenance to runtime, load condition and fuel consumption together |
| Tippers & Dumpers | Tyres; brakes; suspension; hydraulic tipping system; engine and transmission; trip count | Route severity and payload behaviour matter more than raw kilometres; watch fuel per km and harsh braking |
Want maintenance triggers based on real usage, not guesswork?
Aether ties engine hours, idle time and verified fuel data to each asset — so service is triggered by how the machine is actually used.
How to Build a Preventive Maintenance Program: 8 Steps
Step 1: Create an Asset Master
Asset ID, machine category, make and model, year of purchase, engine and chassis number, site allocation, current operator or vendor, fuel tank capacity, service interval, current engine hours, telematics device status, warranty/AMC details. Without a clean asset master, maintenance planning stays scattered.
Step 2: Define Maintenance Intervals by Asset Type
Excavators by engine hours; tippers by kilometres and engine hours; DG sets by runtime and load condition; refuellers by pump usage and vehicle kilometres; loaders by engine hours and application severity. Don't apply one generic schedule to every machine.
Step 3: Connect Actual Usage Data
Use telematics, GPS, fuel sensors and engine data wherever possible to track engine on/off, run hours, idle hours, distance, fuel consumption, draining, location, utilisation and offline device status. This is what makes the rest of the program accurate instead of assumed.
Step 4: Define Fuel and Utilisation Norms
Set expected norms per asset type — expected LPH for excavators by operation mode, expected KMPL for tippers by route type, expected fuel per hour for DG sets by load range, expected idle percentage, expected utilisation per shift. Norms are what make abnormal behaviour visible in the first place.
Step 5: Create a Digital Logsheet
Manual logsheets are easy to dispute. A digital logsheet should capture opening/closing engine hours, runtime, idle time, distance, fuel consumed and draining events, operator and site details, maintenance remarks and downtime reason — once logsheets are digitally validated, both maintenance and billing get more reliable.
Step 6: Track Maintenance Compliance
Every service task needs a status — upcoming, due, overdue, completed, deferred, breakdown-related, reopened — with overdue maintenance visible to P&M, site and management, not buried in a register.
Step 7: Analyse Repeated Failures
A good program doesn't just close service tickets — it studies patterns: repeated hydraulic issues, battery failures, fuel filter choking, tyre wear, overheating, undercarriage damage, high fuel consumption after service, or breakdowns after a missed PM. Repeated issues usually point to something deeper — operator behaviour, site conditions, parts quality, or a maintenance step being skipped.
Step 8: Review Monthly at Management Level
Asset availability, breakdown hours, maintenance compliance, overdue service count, fuel consumption exceptions, idle hour exceptions, high-cost assets, underutilised assets, device health, site-wise compliance, operator and vendor performance. This is what moves maintenance from the workshop to the boardroom.
Heavy Equipment Preventive Maintenance Checklist
A quick-reference version, adaptable across excavators, loaders, dozers, tippers and DG sets. Use this alongside the usage-based triggers above — a checklist alone, without the data behind it, is the pattern this guide opened by flagging as unreliable.
| Frequency | Checks |
|---|---|
| Daily — before start | Engine oil, coolant, hydraulic oil and fuel levels; fuel/oil/coolant/hydraulic leakage; tyres, tracks, undercarriage, belts and hoses; brakes, steering, horn, lights and reverse alarm; GPS / fuel / telematics device online status |
| Daily — after shift | Record engine hours and idle hours; report abnormal sound, smoke, heating, vibration or leakage; record fuel level |
| Weekly | Air filter, fuel filter, hydraulic hoses and cooling system; tyre pressure or track tension and undercarriage wear; idle percentage and abnormal fuel consumption review; compare logsheet hours against telematics hours |
| Monthly | Service due/overdue review by asset; fuel consumption by asset and work type vs. norm; high idle-hour and repeated-breakdown assets; draining exceptions |
| Quarterly | Asset-wise downtime and cost per productive hour; underutilised assets and recurring maintenance issues; retain, overhaul, transfer or replace decisions by asset age |
Important KPIs to Track
- Asset availability — machines available for work vs. required
- Machine uptime — operational time vs. planned working time
- Breakdown hours — time lost to mechanical or electrical failure
- Preventive maintenance compliance — services completed on time
- Overdue maintenance count — assets past their service threshold
- Engine hours / idle hours / productive hours
- Fuel consumption by asset, site, shift or operator; LPH or KMPL vs. norm
- Refuelling accuracy — recorded vs. actual tank-level increase
- Draining or fuel-loss events
- Cost per engine hour vs. cost per productive hour
- Repeat failure rate by asset
- Device health — is GPS, engine and fuel data reporting correctly
Best Practices
- Don't use one checklist for every machine — build separate ones for excavators, loaders, DG sets, tippers, dozers and cranes.
- Service by engine hours and usage, not only calendar dates.
- Separate idle hours from working hours — idle time adds wear without adding output.
- Treat fuel consumption as a health signal, not only a cost metric.
- Connect maintenance planning to utilisation — a well-maintained but underused machine is still a cost problem.
- Keep a complete digital service history per asset.
- Review repeated failures — they usually point to an operational cause, not a parts problem.
- Monitor device health — if GPS, fuel or engine data goes offline, maintenance visibility goes with it.
- Train operators on actual idle time, fuel use and misuse data, not generic guidance.
- Make preventive maintenance a monthly management KPI, reviewed by P&M and project leadership — not a workshop-only metric.
- Build in accountability: who operated the machine, when an issue was first reported, whether the machine kept running after a warning sign, and whether the delay was site-, vendor- or parts-caused.
From Checklist to Intelligence
The old model of preventive maintenance was simple: service the machine before it fails. The model that actually holds up on Indian infrastructure sites is more specific: understand how the machine is being used, catch stress early through verified fuel and hour data, confirm maintenance actions actually happened, and prevent cost leakage before it becomes downtime.
A modern preventive maintenance approach combines OEM schedules, operator inspections, telematics, fuel monitoring, engine hours, idle analysis, digital logsheets, breakdown history and site-wise reporting — with all of it backed by verified data, not self-reported forms.
This is the layer Aether adds: manually verified drain and refuel events, engine-hour and idle-hour tracking, and utilisation data that ties equipment behaviour to fuel, usage and site accountability — not another GPS dashboard, but enforceable evidence behind the numbers your PM schedule already depends on.
See it on your own fleet
Aether runs a free 30-day verified fuel-loss audit on 20 of your assets — real drain and refuel events, verified, mapped against your current engine-hour and maintenance records. No cost, no commitment.
Frequently asked questions
What is the difference between preventive and predictive maintenance for heavy equipment?
Preventive maintenance services equipment on a fixed schedule — engine hours, kilometres or calendar intervals — regardless of current condition. Predictive maintenance uses real-time condition data, such as fuel consumption trends, vibration or hydraulic pressure, to trigger service only when the equipment shows signs of stress. Most construction fleets run a hybrid: OEM-scheduled service intervals, adjusted earlier when fuel or idle data signals a problem.
How often should heavy equipment be serviced?
It depends on engine hours and site severity, not the calendar. Most OEMs specify intervals at 250, 500 and 1,000 engine hours, but machines working in rock breaking, dust, heat or continuous heavy load should be serviced earlier than the standard interval.
Why do engine hours matter more than calendar dates for maintenance scheduling?
Two machines purchased on the same date can have completely different wear if one runs 10 hours a day and the other runs 2. Engine hours reflect actual usage; calendar dates don't. The catch is that engine hours are only useful if they're accurate — manually reported hours are frequently under- or over-stated.
Can fuel consumption data actually predict a breakdown?
Not on its own, but a sustained rise in litres-per-hour for the same activity is one of the earliest available signals of mechanical stress — often visible weeks before a fault shows up physically. It won't tell you exactly what's wrong, but it tells you where to look.
What's the difference between idle hours and productive hours, and why does it matter for maintenance?
Idle hours are time the engine is on with no productive work happening; productive hours are actual work output. A machine can accumulate the same total engine hours with very different amounts of real work behind them — which changes both its true wear pattern and its real cost per hour of output.
How do I build a preventive maintenance checklist for a mixed construction fleet?
Start with an asset master and separate checklists per machine category (excavators, loaders, dozers, DG sets, tippers), then layer in usage-based service triggers — engine hours, fuel norms, idle percentage — on top of the standard daily/weekly/monthly checklist. A single generic checklist across a mixed fleet is the single most common reason preventive maintenance programs underperform.
Related Reading