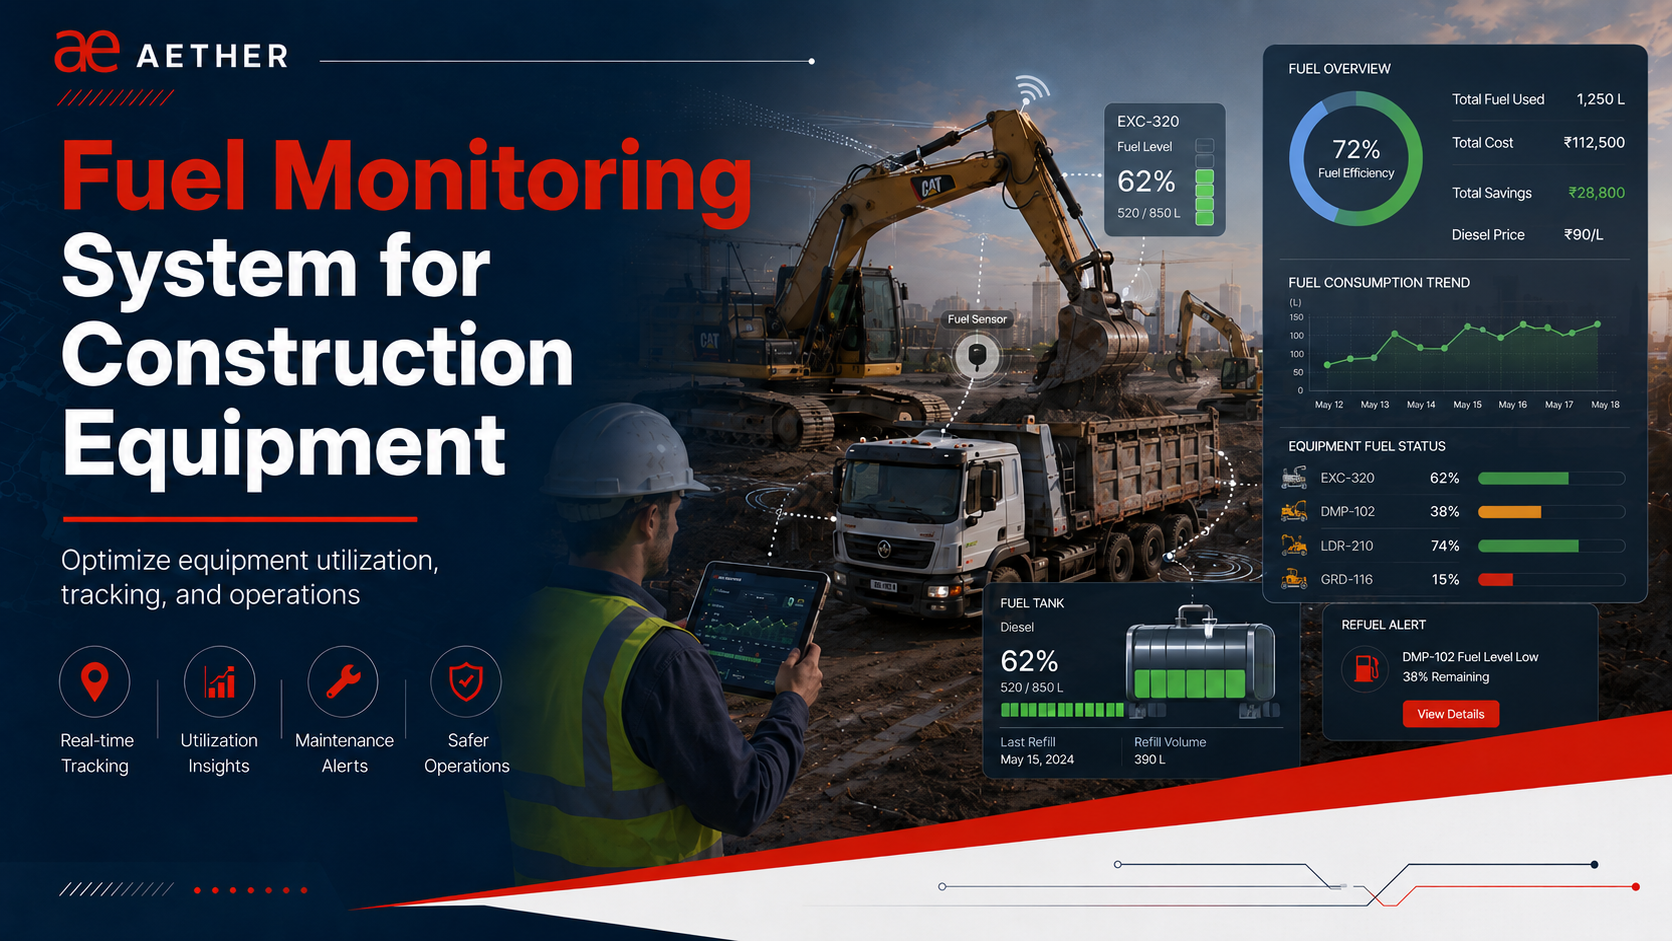
Return Pipe Fuel Theft: How Fuel Losses Hide in Normal Consumption
A small pipe connection added to the return line can drain fuel from a working asset slowly and steadily. The tank level drops slowly, so it may not show as a clear draining event on the portal. It is still big enough to reach hundreds of litres in a month.
The only sign is fuel consume is higher than the work suggests. Thelogsheet matches. The fuel graph looks like normal consumption.
In Brief
Return pipe draining diverts unused diesel away from the tank while the asset is working. The engine keeps running normally, no portal alert fires, and the logsheet looks clean. The only signal is fuel consumption that runs higher than the work explains.
For example, on a construction site, a machine — an excavator, backhoe loader, or any diesel asset — runs a full shift with the engine on and GPS active. A T-joint has been fitted into the return pipe, and fuel that should flow back to the tank instead drains into a hidden container behind the asset.
The engine runs normally. The fuel graph on the portal shows a normal slope — nothing that stands out. A few litres leave every shift — and by month-end, the loss adds up.
Check Hidden Fuel Loss in Your Assets
Share repeated high-consumption cases with Aether and verify whether return pipe draining is happening on site.
What Is Return Pipe Draining?
Return pipe draining is a fuel theft method where unused fuel that should flow back to the tank is diverted into a jerry can while the asset is running.
In diesel engines, the engine pulls more fuel from the tank than it burns. The unused fuel returns to the tank through the return pipe. This is normal engine operation.
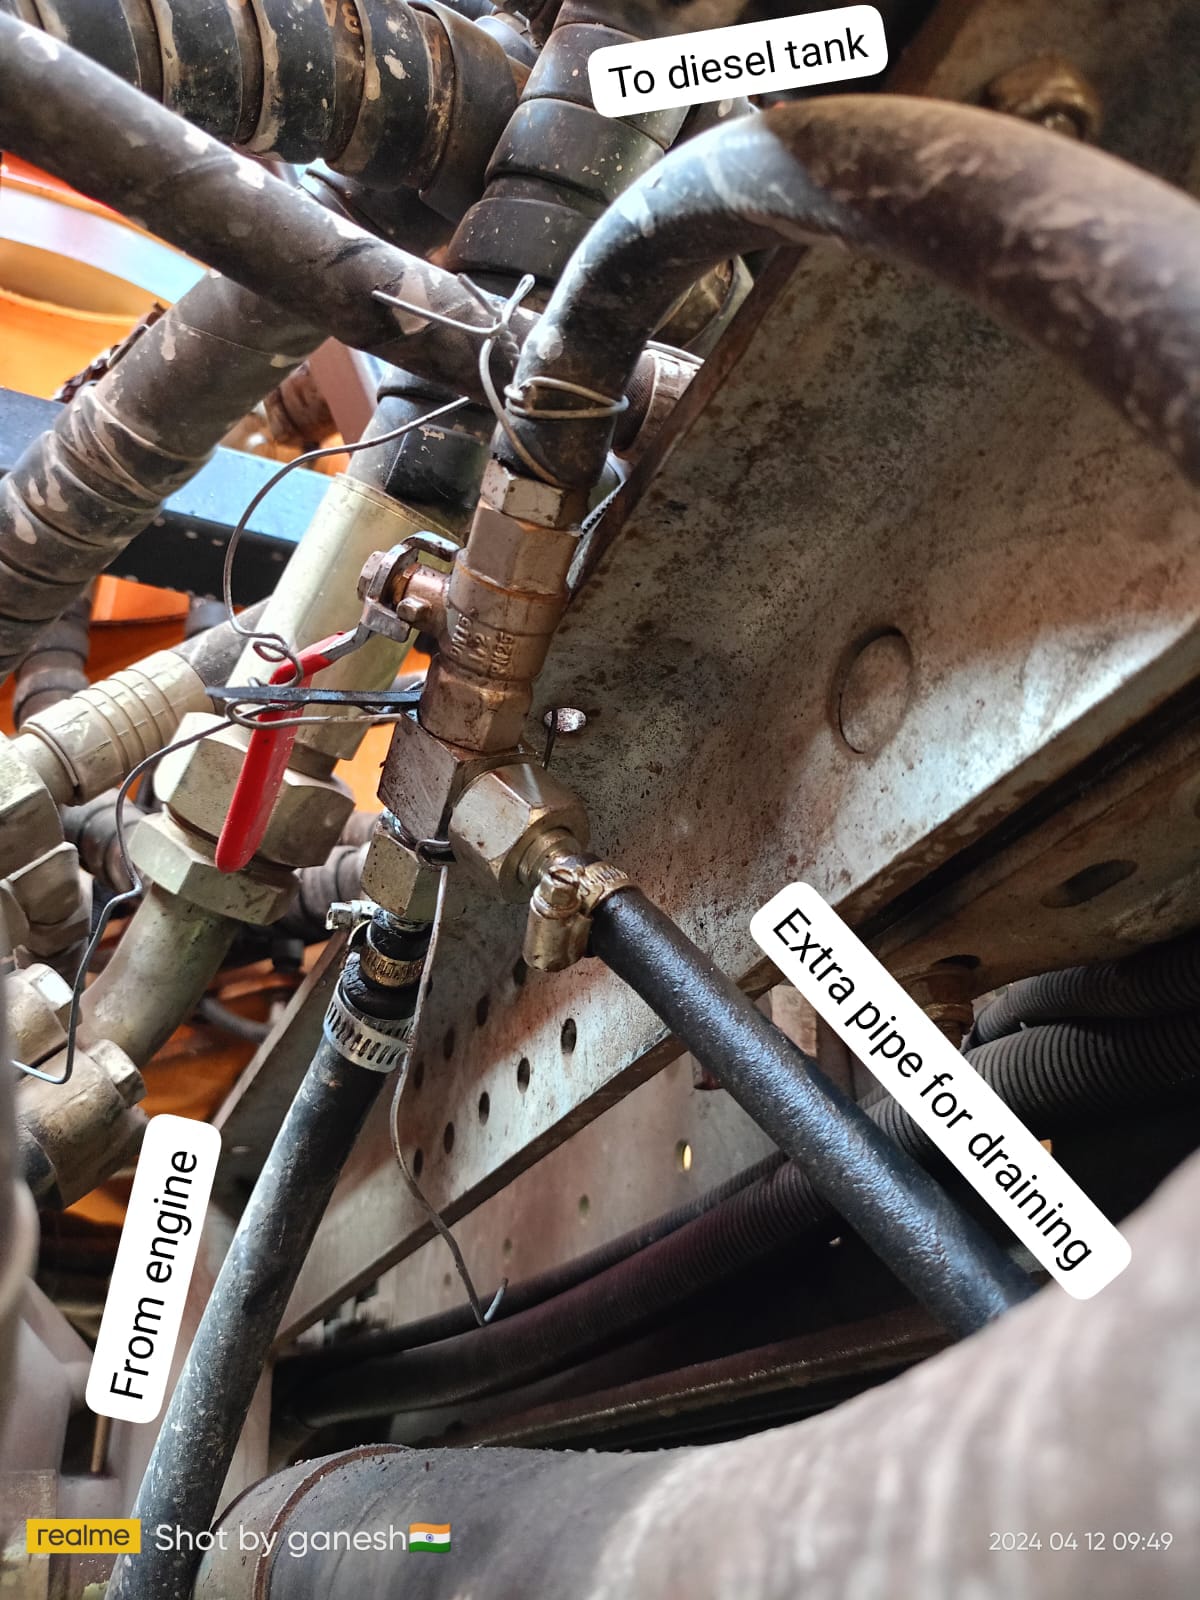
In return pipe draining, a T-joint or thin pipe is fitted into the return pipe. The open end goes into a jerry can behind the asset or under the chassis. The diverted fuel never reaches the tank.
T-joint fitted into the return pipe — real case. Caption: The extra pipe connected at the T-joint diverts fuel away from the tank.
Why Return Pipe Fuel Theft Stays Hidden
The portal can detect refuelling and direct tank draining when fuel drops suddenly. But return pipe draining is different.
Here, fuel is diverted slowly while the asset is operating. The fuel level falls gradually, similar to normal fuel consumption during work. Because the drop stays below the sudden-drain threshold — which is designed to flag sudden losses, not gradual ones — no clear draining event is logged.
| What Looks Normal | Why It Hides the Loss |
|---|---|
| Portal event | The drop is slow and consistent— it stays below the portal’s draining detection threshold, which is designed to flag sudden drops, not gradual ones. |
| Fuel graph | The graph shows a gradual downward slope, similar to normal fuel consumption during operation. |
| Logsheet | Engine hours and movement still match the shift record. |
| GPS | The asset is active and moving, so it appears to be working normally. |
This is why return pipe draining cannot be confirmed from the fuel graph alone. It must be checked against the asset’s verified LPH or KMPL norm, logsheet data, GPS status, sensor health, and repeated consumption pattern.
How Aether Detects and Verifies Return Pipe Draining
Aether does not classify return pipe draining from one graph view. Every case goes through a verification sequence before it is reported.
| Step | What Aether Checks | Why It Matters |
|---|---|---|
| 1. Set LPH/KMPL baseline | The BI team calculates normal LPH for hour-based assets or KMPL for distance-based assets using clean operating sessions. | This creates the verified norm for that asset and work type. |
| 2. Compare actual use | Actual fuel used is compared against expected consumption for the same operating window. | This shows how much fuel use is above the norm, in litres and percentage. |
| 3. Zoom into the fuel graph | The BI team checks whether the fuel graph shows a slow, consistent decline during engine-on time — the key signature of return pipe draining. | This identifies the suspected return pipe draining window. |
| 4. Check the pattern | The same asset is reviewed across multiple shifts or similar operating windows. | One high shift is not enough. You must consume excess amounts repeatedly. |
| 5. Cross-verify engine hours and distance | Engine hours, kilometres, logsheet data, GPS status, connection type, and LLS health are all checked. | Incorrect engine hours, GPS-off periods, or LLS issues can affect the classification. |
| 6. Classify and report | Only after all checks pass does the BI team classify the case as return pipe draining. | The final report includes volume, date range, asset code, evidence, and recommended action. |
Worked Example
LPH-Based Asset
An asset runs for 1 hour. Its verified fuel consumption norm is 4 LPH.
Expected fuel use = 4 litres
Actual fuel drop = 10 litres
Return pipe draining = actual fuel consumed - expected fuel consumption
10 - 4 = 6 litres
So, in this example, the possible return pipe draining volume is 6 litres.
In real analysis, the BI team calculates expected consumption for the actual operating window. This figure may be adjusted slightly depending on the asset’s running period, work type, and verified operating context.
KMPL-Based Asset
For distance-based assets, the same logic uses KMPL.
Expected fuel = distance covered ÷ expected KMPL
Return pipe draining = actual fuel consumed - expected fuel
Example: If an asset covers 20 km and its verified norm is 2 KMPL:
Expected fuel = 20 ÷ 2 = 10 litres
If the actual fuel consumed is 18 litres:
Return pipe draining = 18 - 10 = 8 litres
If GPS was off during the window, distance cannot be verified. In that case, the KMPL-based case cannot be confirmed as return pipe draining.
Common Mistakes That Allow Return Pipe Draining to Continue
| Mistake | Why It Happens | How to Avoid It |
|---|---|---|
| Blaming terrain or heavy load | High consumption gets explained away by site conditions without checking the numbers. | Compare it against the verified norm before accepting any operational reason. |
| Relying only on portal events | Return pipe draining may not show as a clear draining event on the portal. | Track consumption rate, not only draining flags. |
| Checking only one shift | One high-consumption shift may have a valid reason. | Review the same asset across 7–14 days. |
| Ignoring connection type | Ignition-only engine-hour data can overstate runtime. | Confirm the connection type before using LPH figures. |
Weekly Checklist for Return Pipe Draining Detection
Compare actual fuel consumption against expected LPH/KMPL for each asset.
Flag assets that remain above verified norm for three or more consecutive days.
Review 7–14 day consumption trends for flagged assets.
Verify engine hours against the logsheet for hour-based assets.
Check whether the same asset has repeated high-consumption windows.
Share repeated high-consumption cases with Aether’s BI team.
Schedule physical inspection only after the BI team flags the asset.
What to Do After a Return Pipe Draining Case Is Flagged
1. Inspect the Asset
Physically check the return pipe on the flagged asset. See the inspection table below for what to look for.
2. Escalate With Evidence
Share the logsheet, engine hours, shift dates, fuel graph window, and multi-day consumption pattern with Aether’s BI team.
3. Verify Before Acting
Do not raise a debit note or take any action until the BI team's verified report is received
What to Inspect on the Machine
| Inspection Point | What to Look For |
|---|---|
| Return pipe | Loose, cut, or modified section. |
| Added connector or T-joint | Any connector inserted into the return pipe to split fuel flow. Also look for a jerry can tied near the fuel tank area — people often collect diverted fuel there. |
| Clamps and fittings | Fresh marks, loose clamps, or signs of disturbance. |
| Hidden container | Container placed behind the asset, under the chassis, or away from normal view. |
| Fuel stains | Fuel marks near the tank, engine bay, or return pipe area. |
| Temporary setup | Pipe or connector that can be quickly removed after the shift. |
Business Impact of Return Pipe Draining
Unchecked return pipe draining affects more than fuel cost.
It can:
Increase diesel spend without any visible draining event.
Delay root-cause investigation because the asset appears to be operating normally.
Allow recurring fuel loss across multiple shifts before detection.
Create disputes if someone takes action without BI-verified evidence.
Need a BI-Verified Fuel Theft Report?
Get fuel graphs, logsheets, GPS data, and sensor health reviewed before taking operational or financial action.
Frequently Asked Questions
Can an asset lose significant fuel without the daily loss looking large?
Yes. Small excess consumption can become a large monthly loss.
For example, if an asset consumes 3 litres per hour above norm across a 10-hour shift, the excess becomes 30 litres a day. Across 25 working days, that would amount to 750 litres from one asset — without a clear draining event appearing on the portal.
What separates return pipe draining from heavy operation?
Heavy operation often increases fuel use in certain conditions. These include rough terrain, full loads, high idle time, and long trips.
Suspect return pipe draining when the same asset uses more fuel than its verified LPH or KMPL norm. and the work type does not explain the increase.
The pattern must repeat across multiple shifts before classification.
Why is one high-consumption shift not enough?
One high shift may have a valid reason — heavy load, rough terrain, high idle time, longer travel, or a change in work type.
Aether’s BI team looks for repeated high consumption across multiple shifts before classifying a case as return pipe draining.
Related Reading